Fan Projections [theEccentricTrader]█ OVERVIEW
This indicator automatically projects trendlines in the shape of a fan, from a single point of origin. In the example above I have applied the indicator twice to the 1D SPXUSD. The seven upper lines (green) are projected at an angle of -5 from the 1-month swing high anchor point. And the five lower lines (blue) are projected at an angle of 10 from the 1-week swing low anchor point.
█ CONCEPTS
Green and Red Candles
• A green candle is one that closes with a high price equal to or above the price it opened.
• A red candle is one that closes with a low price that is lower than the price it opened.
Swing Highs and Swing Lows
• A swing high is a green candle or series of consecutive green candles followed by a single red candle to complete the swing and form the peak.
• A swing low is a red candle or series of consecutive red candles followed by a single green candle to complete the swing and form the trough.
Peak and Trough Prices (Basic)
• The peak price of a complete swing high is the high price of either the red candle that completes the swing high or the high price of the preceding green candle, depending on which is higher.
• The trough price of a complete swing low is the low price of either the green candle that completes the swing low or the low price of the preceding red candle, depending on which is lower.
Historic Peaks and Troughs
The current, or most recent, peak and trough occurrences are referred to as occurrence zero. Previous peak and trough occurrences are referred to as historic and ordered numerically from right to left, with the most recent historic peak and trough occurrences being occurrence one.
Support and Resistance
• Support refers to a price level where the demand for an asset is strong enough to prevent the price from falling further.
• Resistance refers to a price level where the supply of an asset is strong enough to prevent the price from rising further.
Support and resistance levels are important because they can help traders identify where the price of an asset might pause or reverse its direction, offering potential entry and exit points. For example, a trader might look to buy an asset when it approaches a support level , with the expectation that the price will bounce back up. Alternatively, a trader might look to sell an asset when it approaches a resistance level , with the expectation that the price will drop back down.
It's important to note that support and resistance levels are not always relevant, and the price of an asset can also break through these levels and continue moving in the same direction.
Trendlines
Trendlines are straight lines that are drawn between two or more points on a price chart. These lines are used as dynamic support and resistance levels for making strategic decisions and predictions about future price movements. For example traders will look for price movements along, and reactions to, trendlines in the form of rejections or breakouts/downs.
█ FEATURES
Inputs
• Anchor Point Type
• Swing High/Low Occurrence
• HTF Resolution
• Highest High/Lowest Low Lookback
• Angle Degree
• Number Lines
• Line Color
Anchor Point Types
• Swing High
• Swing Low
• Swing High (HTF)
• Swing Low (HTF)
• Highest High
• Lowest Low
• Intraday Highest High (intraday charts only)
• Intraday Lowest Low (intraday charts only)
Swing High/Swing Low Occurrence
This input is used to determine which historic peak or trough to reference for swing high or swing low anchor point types.
HTF Resolution
This input is used to determine which higher timeframe to reference for swing high (HTF) or swing low (HTF) anchor point types.
Highest High/Lowest Low Lookback
This input is used to determine the lookback length for highest high or lowest low anchor point types.
Intraday Highest High/Lowest Low Lookback
When using intraday highest high or lowest low anchor point types, the lookback length is calculated automatically based on number of bars since the daily candle opened.
Angle Degree
This input is used to determine the angle of the trendlines. The output is expressed in terms of point or pips, depending on the symbol type, which is then passed through the built in math.todegrees() function. Positive numbers will project the lines upwards while negative numbers will project the lines downwards. Depending on the market and timeframe, the impact input values will have on the visible gaps between the lines will vary greatly. For example, an input of 10 will have a far greater impact on the gaps between the lines when viewed from the 1-minute timeframe than it would on the 1-day timeframe. The input is a float and as such the value passed through can go into as many decimal places as the user requires.
It is also worth mentioning that as more lines are added the gaps between the lines, that are closest to the anchor point, will get tighter as they make their way up the y-axis. Although the gaps between the lines will stay constant at the x2 plot, i.e. a distance of 10 points between them, they will gradually get tighter and tighter at the point of origin as the slope of the lines get steeper.
Number Lines
This input is used to determine the number of lines to be drawn on the chart, maximum is 500.
█ LIMITATIONS
All green and red candle calculations are based on differences between open and close prices, as such I have made no attempt to account for green candles that gap lower and close below the close price of the preceding candle, or red candles that gap higher and close above the close price of the preceding candle. This may cause some unexpected behaviour on some markets and timeframes. I can only recommend using 24-hour markets, if and where possible, as there are far fewer gaps and, generally, more data to work with.
If the lines do not draw or you see a study error saying that the script references too many candles in history, this is most likely because the higher timeframe anchor point is not present on the current timeframe. This problem usually occurs when referencing a higher timeframe, such as the 1-month, from a much lower timeframe, such as the 1-minute. How far you can lookback for higher timeframe anchor points on the current timeframe will also be limited by your Trading View subscription plan. Premium users get 20,000 candles worth of data, pro+ and pro users get 10,000, and basic users get 5,000.
█ RAMBLINGS
It is my current thesis that the indicator will work best when used in conjunction with my Wavemeter indicator, which can be used to set the angle. For example, the average wave height or amplitude could be used as the value for the angle input. Or some factor or multiple of such an average. I think this makes sense as it allows for objectivity when applying the indicator across different markets and timeframes with different energies and vibrations.
“If you want to find the secrets of the universe, think in terms of energy, frequency and vibration.”
― Nikola Tesla
ค้นหาในสคริปต์สำหรับ "high low"

Swing Counter [theEccentricTrader]█ OVERVIEW
This indicator counts the number of confirmed swing high and swing low scenarios on any given candlestick chart and displays the statistics in a table, which can be repositioned and resized at the user's discretion.
█ CONCEPTS
Green and Red Candles
• A green candle is one that closes with a high price equal to or above the price it opened.
• A red candle is one that closes with a low price that is lower than the price it opened.
Swing Highs and Swing Lows
• A swing high is a green candle or series of consecutive green candles followed by a single red candle to complete the swing and form the peak.
• A swing low is a red candle or series of consecutive red candles followed by a single green candle to complete the swing and form the trough.
Peak and Trough Prices (Basic)
• The peak price of a complete swing high is the high price of either the red candle that completes the swing high or the high price of the preceding green candle, depending on which is higher.
• The trough price of a complete swing low is the low price of either the green candle that completes the swing low or the low price of the preceding red candle, depending on which is lower.
Peak and Trough Prices (Advanced)
• The advanced peak price of a complete swing high is the high price of either the red candle that completes the swing high or the high price of the highest preceding green candle high price, depending on which is higher.
• The advanced trough price of a complete swing low is the low price of either the green candle that completes the swing low or the low price of the lowest preceding red candle low price, depending on which is lower.
Green and Red Peaks and Troughs
• A green peak is one that derives its price from the green candle/s that constitute the swing high.
• A red peak is one that derives its price from the red candle that completes the swing high.
• A green trough is one that derives its price from the green candle that completes the swing low.
• A red trough is one that derives its price from the red candle/s that constitute the swing low.
Historic Peaks and Troughs
The current, or most recent, peak and trough occurrences are referred to as occurrence zero. Previous peak and trough occurrences are referred to as historic and ordered numerically from right to left, with the most recent historic peak and trough occurrences being occurrence one.
Upper Trends
• A return line uptrend is formed when the current peak price is higher than the preceding peak price.
• A downtrend is formed when the current peak price is lower than the preceding peak price.
• A double-top is formed when the current peak price is equal to the preceding peak price.
Lower Trends
• An uptrend is formed when the current trough price is higher than the preceding trough price.
• A return line downtrend is formed when the current trough price is lower than the preceding trough price.
• A double-bottom is formed when the current trough price is equal to the preceding trough price.
█ FEATURES
Inputs
• Start Date
• End Date
• Position
• Text Size
• Show Sample Period
• Show Plots
• Show Lines
Table
The table is colour coded, consists of three columns and nine rows. Blue cells denote neutral scenarios, green cells denote return line uptrend and uptrend scenarios, and red cells denote downtrend and return line downtrend scenarios.
The swing scenarios are listed in the first column with their corresponding total counts to the right, in the second column. The last row in column one, row nine, displays the sample period which can be adjusted or hidden via indicator settings.
Rows three and four in the third column of the table display the total higher peaks and higher troughs as percentages of total peaks and troughs, respectively. Rows five and six in the third column display the total lower peaks and lower troughs as percentages of total peaks and troughs, respectively. And rows seven and eight display the total double-top peaks and double-bottom troughs as percentages of total peaks and troughs, respectively.
Plots
I have added plots as a visual aid to the swing scenarios listed in the table. Green up-arrows with ‘HP’ denote higher peaks, while green up-arrows with ‘HT’ denote higher troughs. Red down-arrows with ‘LP’ denote higher peaks, while red down-arrows with ‘LT’ denote lower troughs. Similarly, blue diamonds with ‘DT’ denote double-top peaks and blue diamonds with ‘DB’ denote double-bottom troughs. These plots can be hidden via indicator settings.
Lines
I have also added green and red trendlines as a further visual aid to the swing scenarios listed in the table. Green lines denote return line uptrends (higher peaks) and uptrends (higher troughs), while red lines denote downtrends (lower peaks) and return line downtrends (lower troughs). These lines can be hidden via indicator settings.
█ HOW TO USE
This indicator is intended for research purposes and strategy development. I hope it will be useful in helping to gain a better understanding of the underlying dynamics at play on any given market and timeframe. It can, for example, give you an idea of any inherent biases such as a greater proportion of higher peaks to lower peaks. Or a greater proportion of higher troughs to lower troughs. Such information can be very useful when conducting top down analysis across multiple timeframes, or considering entry and exit methods.
What I find most fascinating about this logic, is that the number of swing highs and swing lows will always find equilibrium on each new complete wave cycle. If for example the chart begins with a swing high and ends with a swing low there will be an equal number of swing highs to swing lows. If the chart starts with a swing high and ends with a swing high there will be a difference of one between the two total values until another swing low is formed to complete the wave cycle sequence that began at start of the chart. Almost as if it was a fundamental truth of price action, although quite common sensical in many respects. As they say, what goes up must come down.
The objective logic for swing highs and swing lows I hope will form somewhat of a foundational building block for traders, researchers and developers alike. Not only does it facilitate the objective study of swing highs and swing lows it also facilitates that of ranges, trends, double trends, multi-part trends and patterns. The logic can also be used for objective anchor points. Concepts I will introduce and develop further in future publications.
█ LIMITATIONS
Some higher timeframe candles on tickers with larger lookbacks such as the DXY , do not actually contain all the open, high, low and close (OHLC) data at the beginning of the chart. Instead, they use the close price for open, high and low prices. So, while we can determine whether the close price is higher or lower than the preceding close price, there is no way of knowing what actually happened intra-bar for these candles. And by default candles that close at the same price as the open price, will be counted as green. You can avoid this problem by utilising the sample period filter.
The green and red candle calculations are based solely on differences between open and close prices, as such I have made no attempt to account for green candles that gap lower and close below the close price of the preceding candle, or red candles that gap higher and close above the close price of the preceding candle. I can only recommend using 24-hour markets, if and where possible, as there are far fewer gaps and, generally, more data to work with. Alternatively, you can replace the scenarios with your own logic to account for the gap anomalies, if you are feeling up to the challenge.
The sample size will be limited to your Trading View subscription plan. Premium users get 20,000 candles worth of data, pro+ and pro users get 10,000, and basic users get 5,000. If upgrading is currently not an option, you can always keep a rolling tally of the statistics in an excel spreadsheet or something of the like.
█ NOTES
I feel it important to address the mention of advanced peak and trough price logic. While I have introduced the concept, I have not included the logic in my script for a number of reasons. The most pertinent of which being the amount of extra work I would have to do to include it in a public release versus the actual difference it would make to the statistics. Based on my experience, there are actually only a small number of cases where the advanced peak and trough prices are different from the basic peak and trough prices. And with adequate multi-timeframe analysis any high or low prices that are not captured using basic peak and trough price logic on any given time frame, will no doubt be captured on a higher timeframe. See the example below on the 1H FOREXCOM:USDJPY chart (Figure 1), where the basic peak price logic denoted by the indicator plot does not capture what would be the advanced peak price, but on the 2H FOREXCOM:USDJPY chart (Figure 2), the basic peak logic does capture the advanced peak price from the 1H timeframe.
Figure 1.
Figure 2.
█ RAMBLINGS
“Never was there an age that placed economic interests higher than does our own. Never was the need of a scientific foundation for economic affairs felt more generally or more acutely. And never was the ability of practical men to utilize the achievements of science, in all fields of human activity, greater than in our day. If practical men, therefore, rely wholly on their own experience, and disregard our science in its present state of development, it cannot be due to a lack of serious interest or ability on their part. Nor can their disregard be the result of a haughty rejection of the deeper insight a true science would give into the circumstances and relationships determining the outcome of their activity. The cause of such remarkable indifference must not be sought elsewhere than in the present state of our science itself, in the sterility of all past endeavours to find its empirical foundations.” (Menger, 1871, p.45).
█ BIBLIOGRAPHY
Menger, C. (1871) Principles of Economics. Reprint, Auburn, Alabama: Ludwig Von Mises Institute: 2007.

Black RSI (Pro Suite)Black RSI (Pro Suite) is combination of RSI (Relative Strength Index), Volume RSI, Heikin Ashi RSI & other multi Oscillators with multi features into one indicator, features like (Quad Divergences, Multi Time Frame RSI, MTF RSI Panel, Oscillator Support/Resistance/Wedges/Trendlines, Oscillator Moving Average/BBs, Smooth RSI, RSI Price Estimator, Oscillator Over bought/sold Bars, Osc OB/OS Zones, Osc OB/OS Highlights, additionally Black RSI indicator is flexible & completely customizable).
Indicator goal: I have tried my best to organized RSI & other suitable oscillators and oscillator useful tools into one simple and free indicator for Tradingview users (specifically for Tradingview 'basic' subscription users). suggestions are always welcome. please give feedback & appreciate if you like my work.
Black RSI Indicator Features Summary:
Black RSI indicator includes many features mainly relevant to RSI and other Oscillators, these are briefly highlighted below:
Black RSI Dashboard
Multi Oscillators: Choose between multiple oscillators. All oscillators settings are customizable.
Multi Symbol: Multi Symbol Support, applicable on all oscillators
RSI (Relative Strength Index)
VRSI (Volume Relative Strength Index)
HA RSI (Heikin Ashi Relative Strength Index)
OBV (On Balance Volume)
CVD (Comulative Volume Delta)
MFI (Money Flow Index)
UO (Ultimate Oscillator)
MOM (Momentum Oscillator)
ATR (Average True Range)
Stoch (Stochastic Oscillator)
Stoch RSI (Stochastic RSI)
Oscillator Primary Tools ◢
Oscillator Moving Average/Bollinger Bands
Smooth RSI
Multi Timeframe RSI
Multi Timeframe RSI Panel
RSI Price Estimator
Oscillator Support/Resistance/Wedges/Trendlines
Oscillator Moving Average/BBs: Shows Moving Average for selected oscillator.
Smooth Smooth: Smooths out RSI
Multi Timeframe RSI: Displays Multiple Time Frame/Multiple Symbol RSI and converts it and shows it as it is in current time frame without effecting Primary RSI
Multi Timeframe RSI Panel: Displays Multiple Time Frame/Multiple Symbol RSI values of user input specific timeframes in compact panel (max 8 Time frames)
RSI Price Estimator: Calculates RSI estimate price values of 3 different user specific RSI input levels, RSI x MA cross price and RSI future value of user specific price input level.
Oscillator Support/Resistance/Wedges/Trendlines: Draws Trendlines, Wedges and Support & Resistance lines on selected oscillator
Oscillator Quad Divergence ◢
1st Oscillator Divergence: Traditional divergence indicator with enhancements & customization
2nd Oscillator Divergence: Traditional divergence indicator with enhancements & customization
3rd Oscillator Divergence: Advanced Divergence indicator with source selection, RSI/Price threshold, potential divergences & customization
4th Oscillator Divergence: Pivots divergence indicator with flexible pivots selection & customization
Regular bullish divergences are indicated when price is forming lower lows while an oscillator shows higher lows.
Regular bearish divergences are indicated when price is forming higher highs while an oscillator shows lower highs.
While regular divergences indicate trend reversals, hidden divergences indicate a trend continuation.
When the price is making higher lows and the oscillator is showing lower lows, we speak of a bullish hidden divergence.
When the price is making lower highs and the oscillator shows higher highs, it's a bearish hidden divergence.
Oscillator Secondary Tools ◢
Oscillator HH/LL pivots
Osc OB/OS Color Bars
Osc OB/OS Zones
Osc OB/OS Highlights
Background
Oscillator HH/LL pivots: Shows HH/LL pivot points on selected oscillator
Osc OB/OS Color Bars: Plots color chart bars based on RSI, MFI, Stochastic, Stochastic RSI or combine overbought/oversold conditions
Osc OB/OS Zones: Plots Osc OB/OS Zones with user input levels
Osc OB/OS Highlights: Highlight oscillator OB/OS background area
Background: background color customization
+ Primary RSI Settings ▾
- Primary RSI Length: User input RSI Length value
- Primary RSI Source: User RSI Source selection
- RSI Overbought Threshold: Allows the user to set the RSI overbought threshold value. This Overbought Threshold value will also be applied on "RSI Divergence overbought condition", "RSI OB Color Bars" and "Primary RSI Color Schemes
- RSI Oversold Threshold: Allows the user to set the RSI oversold threshold value. The lower band (oversold line) of RSI. This Oversold Threshold value will also be applied on "RSI Divergence oversold condition", "RSI OS Color Bars" and "Primary RSI Color Schemes
- RSI Middle Band: Allows the user to set the RSI middle band value. This value will also applied to "Center Line" color scheme from "Primary RSI Color Schemes" drop menu
- Primary RSI Colors:
Range color specifies a gradient of colors from the overbought to the oversold threshold user inputs from "Primary RSI" section. Color interpolation also a gradient but smoother than Range color. Center Line is similar but is not a gradient, linked to Middle Band ("Primary RSI" section) and changes color with RSI Middle Band. Traditional is simple with Overbought and Oversold colors change.
- RSI Bullish Band: Allows the user to plot extra/optional RSI band on RSI Oscillator (Note: it will not be plotted if "OB/OS Zone only" enabled from "OB/OS Zone Settings" section)
- RSI Bearish Band: Allows the user to plot extra/optional RSI band on RSI Oscillator (Note: it will not be plotted if "OB/OS Zone only" enabled from "OB/OS Zone Settings" section)
+ Primary RSI Smooth Settings ▾
- Smooth Moving Average Type: User selected Smooth MA type. With RSI Smooth enabled, will also effect all RSI Divergences detection (all divergences will be plot according to "Smoothed RSI line")
- Smooth Moving Average Length: User input Smooth MA length value
+ Oscillator Moving Average Settings ▾
- Osc Moving Average Colors: Allows user to select Bullish/Bearish colors of Oscillator Moving Average
- Osc Moving Average Type: Allows user to select Oscillator MA Type
- Osc Moving Average Length: User input Oscillator MA length value
- Osc Moving Average Thickness: User input Oscillator MA thickness
- BB StdDev: user input Bollinger Bands standard deviation value
+ Stochastic Oscillator Settings ▾
- Same as Traditional/Default indicator
+ Stochastic RSI Oscillator Settings ▾
- Same as Traditional/Default indicator
+ Money Index Flow Settings ▾
- Same as Traditional/Default indicator
+ Ultimate Oscillator Settings ▾
- Same as Traditional/Default indicator
+ Momentum Oscillator Settings ▾
- Same as Traditional/Default indicator
+ Average True Range Settings ▾
- Same as Traditional/Default indicator
+ Multi Timeframe RSI Settings ▾
- MTF RSI Time Frame: Allows user to select MTF RSI Time Frame
- MTF RSI Symbol: Allows user to select MTF RSI Time Symbol
- MTF RSI Length: User input MTF RSI length value
- MTF RSI Source: User selected MTF RSI source
- MTF RSI Line Width: User input MTF RSI line thickness value
- Number of Bars for MTF RSI plot
- MTF RSI Color > OB color > OS color : Allows user to select MTF RSI color with additionally Overbought/Oversold colors
+ MTF RSI Panel Settings ▾
- Select MTF RSI Type: If "Primary RSI" or "Volume RSI" selected MTF RSI Panel will show output values based on "Primary RSI" or "Volume RSI" parameters e.g. source, length, but without smooth.
- MTF RSI Panel Symbol: Allows user to select MTF RSI Panel symbol, leave symbol blank or uncheck "checkbox" for current chart symbol
- Show Symbol in Panel: Shows symbol ticker(current or user selected) in MTF RSI Panel
- Panel Background: Allows user to select MTF RSI Panel Background (enable/disable) and Background color selection
- TF1: MTF RSI Timeframe 1 user selection
- TF2: MTF RSI Timeframe 2 user selection
- TF3: MTF RSI Timeframe 3 user selection
- TF4: MTF RSI Timeframe 4 user selection
- TF5: MTF RSI Timeframe 5 user selection
- TF6: MTF RSI Timeframe 6 user selection
- TF7: MTF RSI Timeframe 7 user selection
- TF8: MTF RSI Timeframe 8 user selection
- Panel Top Offset: MTF RSI Panel offset input value
- Position: MTF RSI Panel position selection
- Text Size: MTF RSI Panel text size selection
- Bullish Colors: MTF RSI Panel bullish color selection. (Bullish colors range RSI >75, <75 to >65, <65 to >55)
- Bearish Colors: MTF RSI Panel bearish color selection. (Bearish colors range RSI <45 to >35, <35 to >25, <25)
+ RSI Price Estimator Settings ▾
- Price 1: User input value for RSI future price
- Price 2: User input value for RSI future price
- Price 3: User input value for RSI future price
- Panel Position Offset: User input value for panel position offset
- Price Decimals: User input value for output price decimals in panel
- Show RSI/OscMA cross Price: Enable/Disable RSIxOscillator MA cross future price
- Show RSI Level for Input Price: User input price for future RSI level
- Invisible Background: Enable/Disable Background
Auto Text Color > Auto color change of Panel text according to Dark/Light chart theme
+ Oscillator Support/Resistance Settings ▾
- Show Support line: Allows user to Enable/Disable Oscillator support line
Color > Auto Color: Auto color change of support line according to Dark/Light chart theme
- Show Resistance line: Allows user to Enable/Disable Oscillator resistance line
Color > Auto Color: Auto color display of resistance line according to Dark/Light chart theme
- Lookback lows/highs: User input of Lookback lows/highs value
- Distance threshold: Distance from the line to the low
- Line touch points: Number of points that have to be around the line
- Low/High left bars: User input of Low/High left bars value
- Low/High right bars: User input of Low/High right bars value
- Line style: User selection of line style
- Line thickness: User input of line thickness value
+ Oscillator 1st Divergence Settings ▾
- Divergence Source: User selection of divergence source. "High/Low" (high/low of oscillator/price divergence detection), "Close" (close of oscillator/price divergence detection) and "Both" (Both Close + High/Low of oscillator/price divergence detection). (Note: Traditional Divergence indicator default source is "High/Low")
- Pivot Lookback Right: How many candle to compare on the right side of a candle when deciding whether it is a pivot. The lower the number is, the earlier pivots (and therefore divergences) will be signaled, but the quality of those detections could be lower.
- Pivot Lookback Left: How many candle to compare on the left side of a candle when deciding whether it is a pivot. The lower the number is, the earlier pivots (and therefore divergences) will be signaled, but the quality of those detections could be lower.
- Divergence Max Length (Bars): The maximum length of a divergence (number of bars). If a detected divergence is longer than this, it will be discarded
- Divergence Min Length (Bars): The minimum length of a divergence (number of bars). If a detected divergence is shorter than this, it will be discarded
- Show Divergence as:
- Line Thickness: User input divergence line thickness value
- Label Transparency: it could reduce labels mess on oscillator line, input "100" for label text only without label background
- Labels Text Color: User label text color selection
Auto Text Color > Auto color change of label text according to Dark/Light chart theme
- Bull Divergences: Enable/Disable of Bull divergences
> Color: User selection of Bull divergence color
> Oversold only: It will show Regular Bullish RSI divergences in oversold zone only, RSI oversold threshold can be configure in "Primary RSI Settings" section.
- Bear Divergences: Enable/Disable of Bear divergences
> Color: User selection of Bear divergence color
> Overbought only: It will show Regular Bearish RSI divergences in overbought zone only, RSI overbought threshold can be configure in "Primary RSI Settings" section.
- Hidden Bull Div: Enable/Disable of Hidden Bull divergences
> Color: User selection of Hidden Bull divergence color
- Hidden Bear Div: Enable/Disable of Hidden Bear divergences
> Color: User selection of Hidden Bear divergence color
+ Oscillator 2nd Divergence Settings ▾
- Same as Oscillator 1st Divergence Settings
+ Oscillator 3rd Divergence Settings ▾
- Divergence source: User selection of divergence source . "oscillator" (divergence detection with high/low or close of selected oscillator), "price" (divergence detection with high/low or close of price)
- Bull price source: User selection of Bull price source. Bull price source: "Low" (low of price divergence detection), "Close" (close of price divergence detection) (linked to "price" in "Divergence source")
- Bear price source: User selection of Bear price source. Bear price source: "High" (high of price divergence detection), "Close" (close of price divergence detection) (linked to "price" in "Divergence source")
- Low/High left bars: How many candle to compare on the left side of a candle when deciding whether it is a pivot. The lower the number is, the earlier pivots (and therefore divergences) will be signaled, but the quality of those detections could be lower.
- Low/High right bars: How many candle to compare on the right side of a candle when deciding whether it is a pivot. The lower the number is, the earlier pivots (and therefore divergences) will be signaled, but the quality of those detections could be lower.
- Maximum lookback bars: The maximum length of a divergence (number of bars). If a detected divergence is longer than this, it will be discarded.
- Price threshold: User selection of Price threshold, higher values more lines
- RSI threshold: User selection of RSI threshold, higher values more lines
- Show Lows: Displays lows of RSI
- Show Highs: Displays highs of RSI
- Show Divergence as:
- Line Style:
- Line thickness: User input divergence line thickness value
- Label Transparency: it could reduce labels mess on oscillator line, input "100" for label text only without label background
- Labels Text Color: User label text color selection
Auto Text Color > Auto color change of label text according to Dark/Light chart theme
- Bull Divergences: Enable/Disable of Bull divergences
> Color: User selection of Bull divergence color
> Potential Bull: It will plot potential regular bull divergence with dotted line.
- Bear Divergences: Enable/Disable of Bear divergences
> Color: User selection of Bear divergence color
> Potential Bear: It will plot potential regular bear divergence with dotted line.
- Hidden Bull Div: Enable/Disable of Hidden Bull divergences
> Color: User selection of Hidden Bull divergence color
> Potential H.Bull: It will plot potential hidden bull divergence with dotted line.
- Hidden Bear Div: Enable/Disable of Hidden Bear divergences
> Color: User selection of Hidden Bear divergence color
> Hidden Bear divergence: It will plot potential hidden bear divergence with dotted line.
> Regular Bull oversold only: It will show Regular Bullish RSI divergences in oversold zone only, RSI oversold threshold can be configure in "Primary RSI Settings" section.
> Regular Bear overbought only: It will show Regular Bearish RSI divergences in overbought zone only, RSI overbought threshold can be configure in "Primary RSI Settings" section.
+ Oscillator 4th Divergences Settings ▾
- Upper Length: User pivot input value of draw upper divergence line From
- To Pivot:
- Lower Length: User pivot input value of draw lower divergence line From
- To Pivot:
- Show Divergence as:
- Line Style:
- Line thickness: User input divergence line thickness value
- Label Transparency: it could reduce labels mess on oscillator line, input "100" for label text only without label background
- Labels Text Color: User label text color selection
Auto Text Color > Auto color change of label text according to Dark/Light chart theme
- Bull Divergences: Enable/Disable of Bull divergences
> Color: User selection of Bull divergence color
- Bear Divergences: Enable/Disable of Bear divergences
> Color: User selection of Bear divergence color
- Regular Bull oversold only: It will show Regular Bullish RSI divergences in oversold zone only, RSI oversold threshold can be configure in "Primary RSI Settings" section.
- Regular Bear overbought only: It will show Regular Bearish RSI divergences in overbought zone only, RSI overbought threshold can be configure in "Primary RSI Settings" section.
+ Oscillator HHLL Pivots Settings ▾
- Pivot Length: User input value of HH/LL pivot length
> L.Text Color: User label text color selection
- HH color: User HH Label color selection
- HL color: User HL Label color selection
- LH color: User LH Label color selection
- LL color: User LL Label color selection
+ Oscillator OB/OS Colored Bars Settings▾
- Overbought/Oversold Bars Oscillator: Plots Overbought/Oversold color bars based on RSI, MFI, Stoch, Stoch RSI overbought/oversold threshold conditions separately or combined(when every oscillator reach its OB or OS threshold condition at same time).
- Overbought Bar Color: User RSI OB Bars color selection
- Oversold Bar Color: User RSI OS Bars color selection
+ Primary RSI Range Color ▾
- OB: Overbought Color
- OS: Oversold Color
- Bullish: Bullish Color
- Bearish: Bearish Color
+ Primary RSI Color interpolation ▾
- RSI Color: RSI Color
- OB: Overbought Color
- OS: Oversold Color
+ Primary RSI Center Line Color ▾
- OB: Overbought Color
- Bullish: Bullish Color
- Bearish: Bearish Color
- OS: Oversold Color
+ Primary RSI Traditional Color ▾
- RSI Color: RSI Color
- OB: Overbought Color
- OS: Oversold Color
Osc Overbought/Oversold Zones Settings ▾
- OB/OS Zone Band Lines: Enable/Disable OB/OS Zone Band Lines
- OB/OS Zones only: Only shows OB/OS Zones and disable all RSI band lines except Middle Band. Background will not be effected by this setting.
- Overbought Zone: User input value of Overbought Zone from
> To:
- Oversold Zone: User input value of Oversold Zone from
> To:
Osc Overbought/Oversold Highlights ▾
- Overbought Highlights : Enable/Disable Overbought Highlights
- Oversold Highlights : Enable/Disable Oversold Highlights
- Transparency: Gradient transparency of highlighted area
+ 'Oscillators Color Settings ▾
- Show Osc Symbol label : Enable/Disable of oscillator symbol label. Displays current oscillator symbol, but with "Override Oscillator Symbol" enabled from "Black RSI Dashboard" it will Auto/forcefully displays Override Oscillator Symbol on Oscillator
- Fade out Oscillator line: Fade out the oscillator line color, focusing only the most recent periods prominent for a clearer chart
- Fill Stoch/StochRSI lines: Fills Stoch/Stoch RSI lines
- Oscillator line thickness: user input value of oscillator line thickness
- Oscillator line offset: Shifts the oscillator to the left or to the right on the given number of bars, Default is 0
- OBV Color
- MFI Color
- ATR Color
- UO Color
- MOM Color
- CVD Bullish Color
- CVD Bearish Color
+ Background Setting ▾
- Custom Background Color: User selection of Background color
Authors & Credits: I'd like to THANK to Nabeel Black(myself), LonesomeTheBlue, iFuSiiOnzZ, jmosullivan, zdmre, creengrack, and TradingView for the locally sourced ingredients.
Disclaimer: DYOR. Not financial advice. Not a trading system. I am not affiliated with TradingView or any authors mentioned here; You alone have the sole responsibility of evaluating the script output and risks associated with the use of the script. Trading success is all about following your trading strategy and the indicators should fit within your trading strategy, and not to be traded upon solely. Always trade with confluence and Risk Management.
Feedback & Bug report
if you found any bug in this indicator or any suggestion, please let me know. Please give feedback & appreciate if you like to see more future updates and indicators. Thank you

Larry Williams Strategies IndicatorThis indicator is a trend following indicator. It plots some of the trend following strategies described by Larry Williams in his book 'Long Term Secrets to Short Term Trading'. Below are types of trend following strategies you can trade using this indicator. These are notes taken directly from Larry Williams' book.
Short Term Low Strategy
Short Term Low - Any daily low with higher lows on each side of it.
Intermediate Term Low – Any short term low with higher short term lows on each side of it.
Long Term Low – Any intermediate term low with higher intermediate term lows on each side of it.
Conceptual pattern for best buying opportunity is when forming an intermediate term low higher than the last intermediate term low.
This setup can be used on all time frames. However since Larry Williams usually trades the daily chart, the daily chart is probably the best timeframe to trade using this strategy.
Entry point – High of the day that has a higher high on the right side of it.
(My interpretation: price crossing above the high of the previous day is the buy signal)
Target – Markets have a strong tendency to rally above the last intermediate term high by the same amount it moved from the last intermediate term high to the lowest point prior to advancing to new highs.
Trailing Stop – Set stop to most recent short term low, move up as new short term lows are formed. Can also use formation of next intermediate term high as an exit point.
A 'run' to the upside is over when price fails to move higher the next day and falls below the prior day's low.
Short Term High Strategy
Short Term High - Any daily high with lower highs on each side of it.
Intermediate Term High – Any short term high with lower short term highs on each side of it.
Long Term High – Any intermediate term high with lower intermediate term highs on each side of it.
Conceptual pattern for best selling opportunity is when forming an intermediate term high lower than the last intermediate term high.
This setup can be used on all time frames. However since Larry Williams usually trades the daily chart, the daily chart is probably the best timeframe to trade using this strategy.
Entry point – Low of the day that has a lower low on the right side of it.
(My interpretation: price crossing below the low of the previous day is the sell short signal)
Target – Markets have a strong tendency to fall below the last intermediate term low by the same amount it moved from the last intermediate term low to the highest point prior to declining to new lows.
Trailing Stop – Set stop to most recent short term high, move down as new short term highs are formed. Can also use formation of next intermediate term low as an exit point.
A 'run' to the downside is over when price fails to move lower the next day and rises above the prior day's high.
Trend Reversals
A trend change from down to up occurs when a short term high is exceeded on the upside, a trend change from up to down is identified by price going below the most recent low.
Can take these signals to make trades, but it is best to filter them with a confirmation or edge such as Trading Day of the Week, Trading Day of the Month, trendlines, etc. to cut down on false signals.
Three Bar High/Low System
Calculate a three bar moving average of the highs and a three bar moving average of the lows.
Strategy is to buy at the at the price of the three bar moving average of the lows - if the trend is positive according to the swing point trend identification technique - and take profits at the three bar moving average of the highs.
Selling is just the opposite. Sell short at the three bar moving average of the highs and take profits at the three bar moving average of the lows, using the trend identification technique above for confirmation.
This strategy can work on any timeframe, but was described as a daytrading system by Larry Williams.

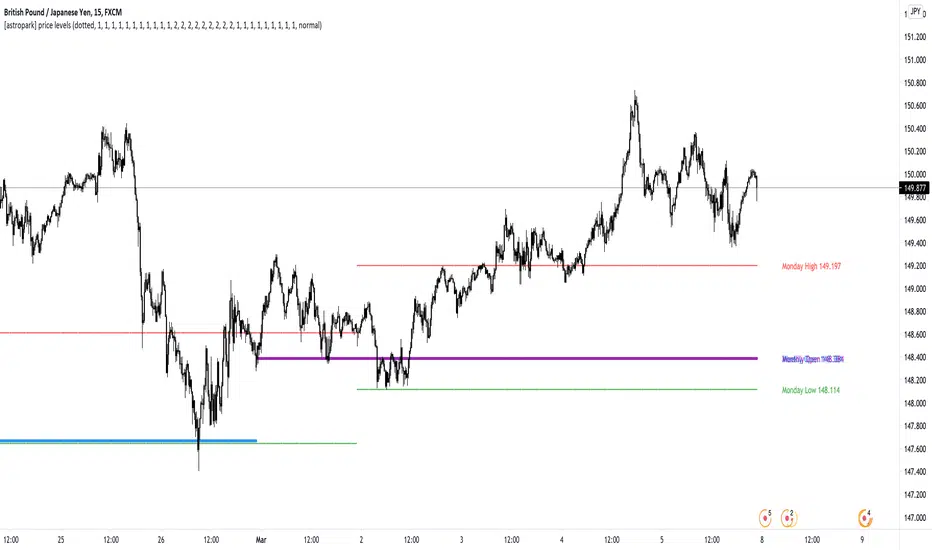
[astropark] price levelsDear Followers,
today another awesome Analysis Tool, that you can use in your trading journey: Price Levels !
Are you a range trading player? a scalper? or maybe a day-trader or a swing-trader? This is for you then. Indeed it's for everyone.
This indicator works on every timeframe, market and pair.
It keeps track of recent important levels generated by price action:
Monday high, low and middle range level
Tuesday high and low
Wednesday high and low
Thursday high and low
Friday high and low
Weekly open, high and low
Monthly open, high and low
Yearly open, high and low
Previous weekly open, high and low
Previous monthly open, high and low
Previous yearly open, high and low
You can:
choose price levels to hide and show
change each level color / thickness / display style (solid or dotted)
choose to show or hide price labels and change their size
Why such indicator should be helpful? How can I use it to do profit?
In multiple ways! Let's talk about Monday Range :
when Monday range is formed, price acceptance below Monday low is a bearish signal, so will more likely want to short / sell
equally price acceptance above Monday high is a bullish signal, so will more likely want to long / buy
it can happen that Monday high is simply retested, with price not being able to stay above it: this is called a retest (in case of a simple wick) or a deviation (in case of price staying above the level just for some candles) and what usually happens is price falling back to Monday middle range level and even back to Monday low.
the opposite can happen of course: you will become bullish if Monday low is tested or a deviation appears below Monday low: price tends to bounce on such occasions back to Monday middle range or even Monday high
Tuesday is usually a marker day within a trading week:
if Monday was pretty bullish, Tuesday high may mark the weekly top, following some red days
if Monday was pretty bearish, Tuesday low may mark the weekly bottom, following some green days
Thursday is the day when big players start to take profits, as the trading week is going to end the next day, so in an all-green week Thursday may be a red one, while in an all-red week it may be a bullish day
Thursday is the day when big players start to take profits, as the trading week is going to end the next day:
in an all-green week, Thursday may be a red one and it's low tends to mark the weekly low
while in an all-red week, it tends to be a bullish day, so here you will refill your shorts for the next blooding day
Let's talk now about the Weekly, Monthly and Yearly price levels : here it is the interesting part for Swing Traders
Weekly open is usually a defining level: on retest, if price keeps staying below then more downside is expected, if price keeps staying above then more upside is expected (similarly to what we said about Monday high and low)
Monthly and Yearly open price levels are usually a "no-brainer" buy level in a bullish trend or equally a sell level in a bearish trend: in this scenarios, a deviation structure is even more powerful in term of price reaction and efficiency
We trade Weekly, Monthly and Yearly high and low price levels as explained for the Monday high and low, but with a swing traders perspective (so a medium-long term trade)
Previous Weekly/Monthly/Yearly price levels are usually very useful as targets in your trades
Here below some screenshots that resumes what said above.
Weekly Open as support (bullish) and Monday High deviation (bearish)
Tuesday High, Weekly Open failing as support: bearish
Monday Low deviation (bullish)
Price Acceptance above Monday High and Weekly Open (bullish)
Yearly Open retests as buy opportunities
Deviation below Monthly Open (bullish), Price Acceptance below Monthly and Yearly Open (bearish)
This is a premium indicator , so send me a private message in order to get access to this script.
Kawabunga Swing Failure Points Candles (SFP) by RRBKawabunga Swing Failure Points Candles (SFP) by RagingRocketBull 2019
Version 1.0
This indicator shows Swing Failure Points (SFP) and Swing Confirmation Points (SCP) as candles on a chart.
SFP/SCP candles are used by traders as signals for trend confirmation/possible reversal.
The signal is stronger on a higher volume/larger candle size.
A Swing Failure Point (SFP) candle is used to spot a reversal:
- up trend SFP is a failure to close above prev high after making a new higher high => implies reversal down
- down trend SFP is a failure to close below prev low after making a new lower low => implies reversal up
A Swing Confirmation Point (SCP) candle is just the opposite and is used to confirm the current trend:
- up trend SCP is a successful close above prev high after making a new higher high => confirms the trend and implies continuation up
- down trend SCP is a successful close below prev low after making a new lower low => confirms the trend and implies continuation down
Features:
- uses fractal pivots with optional filter
- show/hide SFP/SCP candles, pivots, zigzag, last min/max pivot bands
- dim lag zones/hide false signals introduced by lagging fractals or
- use unconfirmed pivots to eliminate fractal lag/false signals. 2 modes: fractals 1,1 and highest/lowest
- filter only SFP/SCP candles confirmed with volume/candle size
- SFP/SCP candles color highlighting, dim non-important bars
Usage:
- adjust fractal settings to get pivots that best match your data (lower values => more frequent pivots. 0,0 - each candle is a pivot)
- use one of the unconfirmed pivot modes to eliminate false signals or just ignore all signals in the gray lag zones
- optionally filter only SFP/SCP candles with large volume/candle size (volume % change relative to prev bar, abs candle body size value)
- up/down trend SCP (lime/fuchsia) => continuation up/down; up/down trend SFP (orange/aqua) => possible reversal down/up. lime/aqua => up; fuchsia/orange => down.
- when in doubt use show/hide pivots/unconfirmed pivots, min/max pivot bands to see which prev pivot and min/max value were used in comparisons to generate a signal on the following candle.
- disable offset to check on which bar the signal was generated
Notes:
Fractal Pivots:
- SFP/SCP candles depend on fractal pivots, you will get different signals with different pivot settings. Usually 4,4 or 2,2 settings are used to produce fractal pivots, but you can try custom values that fit your data best.
- fractal pivots are a mixed series of highs and lows in no particular order. Pivots must be filtered to produce a proper zigzag where ideally a high is followed by a low and another high in orderly fashion.
Fractal Lag/False Signals:
- only past fractal pivots can be processed on the current bar introducing a lag, therefore, pivots and min/max pivot bands are shown with offset=-rightBars to match their target bars. For unconfirmed pivots an offset=-1 is used with a lag of just 1 bar.
- new pivot is not a confirmed fractal and "does not exist yet" while the distance between it and the current bar is < rightBars => prev old fractal pivot in the same dir is used for comparisons => gives a false signal for that dir
- to show false signals enable lag zones. SFP/SCP candles in lag zones are false. New pivots will be eventually confirmed, but meanwhile you get a false signal because prev pivot in the same dir was used instead.
- to solve this problem you can either temporary hide false signals or completely eliminate them by using unconfirmed pivots of a smaller degree/lag.
- hiding false signals only works for history and should be used only temporary (left disabled). In realtime/replay mode it disables all signals altogether due to TradingView's bug (barcolor doesn't support negative offsets)
Unconfirmed Pivots:
- you have 2 methods to check for unconfirmed pivots: highest/lowest(rightBars) or fractals(1,1) with a min possible step. The first is essentially fractals(0,0) where each candle is a pivot. Both produce more frequent pivots (weaker signals).
- an unconfirmed pivot is used in comparisons to generate a valid signal only when it is a higher high (> max high) or a lower low (< min low) in the dir of a trend. Confirmed pivots of a higher degree are not affected. Zigzag is not affected.
- you can also manually disable the offset to check on which bar the pivot was confirmed. If the pivot just before an SCP/SFP suddenly jumps ahead of it - prev pivot was used, generating a false signal.
- last max high/min low bands can be used to check which value was used in candle comparison to generate a signal: min(pivot min_low, upivot min_low) and max(pivot max_high, upivot max_high) are used
- in the unconfirmed pivots mode the max high/min low pivot bands partially break because you can't have a variable offset to match the random pos of an unconfirmed pivot (anywhere in 0..rightBars from the current bar) to its target bar.
- in the unconfirmed pivots mode h (green) and l (red) pivots become H and L, and h (lime) and l (fuchsia) are used to show unconfirmed pivots of a smaller degree. Some of them will be confirmed later as H and L pivots of a higher degree.
Pivot Filter:
- pivot filter is used to produce a better looking zigzag. Essentially it keeps only higher highs/lower lows in the trend direction until it changes, skipping:
- after a new high: all subsequent lower highs until a new low
- after a new low: all subsequent higher lows until a new high
- you can't filter out all prev highs/lows to keep just the last min/max pivots of the current swing because they were already confirmed as pivots and you can't delete/change history
- alternatively you could just pick the first high following a low and the first low following a high in a sequence and ignore the rest of the pivots in the same dir, producing a crude looking zigzag where obvious max high/min lows are ignored.
- pivot filter affects SCP/SFP signals because it skips some pivots
- pivot filter is not applied to/not affected by the unconfirmed pivots
- zigzag is affected by pivot filter, but not by the unconfirmed pivots. You can't have both high/low on the same bar in a zigzag. High has priority over Low.
- keep same bar pivots option lets you choose which pivots to keep when there are both high/low pivots on the same bar (both kept by default)
SCP/SFP Filters:
- you can confirm/filter only SCP/SFP signals with volume % change/candle size larger than delta. Higher volume/larger candle means stronger signal.
- technically SCP/SFP is always the first matching candle, but it can be invalidated by the following signal in the opposite dir which in turn can be negated by the next signal.
- show first matching SCP/SFP = true - shows only the first signal candle (and any invalidations that follow) and hides further duplicate signals in the same dir, does not highlight the trend.
- show first matching SCP/SFP = false - produces a sequence of candles with duplicate signals, highlights the whole trend until its dir changes (new pivot).
Good Luck! Feel free to learn from/reuse the code to build your own indicators!

Previous Day Week Month Highs & Lows [MHA Finverse]Previous Day Week Month Highs & Lows is a comprehensive multi-timeframe indicator that automatically plots previous period highs and lows across Daily, Weekly, Monthly, 4-Hour, and 8-Hour timeframes. Perfect for identifying key support and resistance levels that often act as magnets for price action.
How It Works
The indicator retrieves the highest high and lowest low from the previous completed period for each selected timeframe. Lines extend forward into current price action, allowing you to see when price approaches or breaks these critical levels in real-time. The indicator tracks the exact bar where each high and low occurred, ensuring accurate historical placement.
---
Key Features
Multi-Timeframe Levels:
• Current Daily, Previous Daily, 4H, 8H, Weekly, and Monthly highs/lows
• Fully customizable colors and line styles (Solid, Dashed, Dotted)
• Adjustable line width and extension length
Visual Enhancements:
• Price labels showing exact level values
• Range position percentage (distance from high/low)
• Optional period boxes highlighting timeframe ranges
• Day and date labels for reference
Trading Tools:
• Breakout markers when price crosses key levels
• Touch count tracking (how many times price tested each level)
• Time at level display (consolidation detection)
• Customizable thresholds for touch and time analysis
Alert System:
• Individual alerts for each timeframe: Daily High/Low Break, 4H High/Low Break, 8H High/Low Break, Weekly High/Low Break, Monthly High/Low Break
• Toggle switches to enable/disable alerts per timeframe
• Clear messages showing which level was broken and at what price
---
How to Use
Setup:
1. Enable your preferred timeframes in "Highs & Lows MTF" settings
2. Customize colors and styles to match your chart
3. Turn on visual features like price labels and range percentages
4. Set up alerts by creating specific alert conditions or using toggle switches
Trading Applications:
Breakout Trading: Watch for strong momentum when price breaks above previous highs or below previous lows
Support/Resistance: Use these levels as potential reversal points for entry/exit signals
Range Trading: Trade between previous highs and lows using the range position indicator
Stop Loss Placement: Place stops just beyond previous highs (shorts) or lows (longs)
Multiple Timeframe Confirmation: Combine timeframes for stronger signals (e.g., Daily near Weekly support)
---
Best Practices
• Use Weekly/Monthly for swing trading, Daily/4H/8H for day trading
• Combine with volume or momentum indicators for confirmation
• Multiple timeframe levels clustering together create high-probability zones
• The more touches a level has, the more significant it becomes
---
Disclaimer
This indicator is a technical analysis tool for identifying price levels based on historical data. It does not guarantee profits or predict future movements. Trading involves substantial risk. Always use proper risk management and never risk more than you can afford to lose.

Smart Divergence Engine Overlay [ChartNation]SMART DIVERGENCE ENGINE OVERLAY — CANDLE-ANCHORED RSI DIVERGENCE VISUALIZATION
═══════════════════════════════════════════
TECHNICAL OVERVIEW
═══════════════════════════════════════════
Smart Divergence Engine Overlay renders pivot-confirmed RSI divergences directly on the price chart with candle-anchored lines and labels. This companion overlay shares the identical detection logic as the panel version but visualizes signals at their exact price levels rather than in oscillator space.
The overlay implements repainting-proof divergence detection through pivot-locked RSI evaluation at historical bars (rsi ), ensuring all lines and labels remain stable as new bars form. Visual elements anchor to xloc.bar_index coordinates, maintaining precise positioning across zoom levels and timeframe changes.
═══════════════════════════════════════════
CORE ARCHITECTURE
═══════════════════════════════════════════
PIVOT-LOCKED DETECTION SYSTEM
The overlay evaluates RSI at confirmed pivot bars, not at the current bar:
Technical implementation:
Price pivots detected via ta.pivotlow() / ta.pivothigh() with configurable Left/Right parameters
RSI value captured at the pivot bar: rsi (historical bar offset)
Divergence comparison performed between stored pivot values (lowRsiPrev vs lowRsiCurr)
State management via var floats prevents recalculation across bars
Result: Once a divergence line prints, it never moves or disappears. Historical stability is guaranteed because RSI evaluation occurs at a locked bar index (bar_index - pivotR), not at the moving present.
Bullish divergence logic:
if not na(lowPricePrev) and lowPriceCurr < lowPricePrev and lowRsiCurr > lowRsiPrev
→ Price made lower low, RSI made higher low
→ Divergence confirmed at lowIdxCurr (pivot bar index)
Bearish divergence logic:
if not na(highPricePrev) and highPriceCurr > highPricePrev and highRsiCurr < highRsiPrev
→ Price made higher high, RSI made lower high
→ Divergence confirmed at highIdxCurr (pivot bar index)
RSI ENGINE
The overlay uses the same RSI calculation as the panel version to ensure signal synchronization:
Base calculation: ta.rsi(src, 14) — standard RSI momentum window
Smoothing layer: ta.rma(rsiRaw, 2) — reduces high-frequency noise
Volatility bands: 34-period SMA basis with 1.618 standard deviation multiplier
Purpose: Bands define adaptive overbought/oversold context (not plotted on overlay)
The volatility framework exists in the calculation layer to maintain logic parity with the panel version, ensuring divergences trigger at identical bars across both implementations.
CANDLE-ANCHORED RENDERING
All visual elements use xloc.bar_index positioning:
Line rendering:
line.new(x1=lowIdxPrev, y1=lowPricePrev, x2=lowIdxCurr, y2=lowPriceCurr,
xloc=xloc.bar_index, color=bullCol, width=lineW)
This anchors lines to specific bar indices and price levels, not to time coordinates. Result: Lines maintain exact positioning when zooming, panning, or switching timeframes.
Label rendering:
label.new(x=lowIdxCurr, y=lowPriceCurr, text="BUY",
xloc=xloc.bar_index, style=label.style_label_up)
Labels attach to the second pivot's bar index and price level, scaling naturally with chart transformations.
═══════════════════════════════════════════
VISUAL IMPLEMENTATION
═══════════════════════════════════════════
DIVERGENCE LINES
Bullish divergence: Connects two price swing lows with upward-sloping line
Color: Configurable (default lime green)
Width: 1-6 pixels (configurable)
Endpoint 1: Previous swing low (lowPricePrev at lowIdxPrev)
Endpoint 2: Current swing low (lowPriceCurr at lowIdxCurr)
Requirement: Current price lower than previous, current RSI higher than previous
Bearish divergence: Connects two price swing highs with downward-sloping line
Color: Configurable (default red)
Width: 1-6 pixels (configurable)
Endpoint 1: Previous swing high (highPricePrev at highIdxPrev)
Endpoint 2: Current swing high (highPriceCurr at highIdxCurr)
Requirement: Current price higher than previous, current RSI lower than previous
Lines extend between pivot bars only (extend.none), never projecting into future.
DIVERGENCE LABELS
Optional BUY/SELL markers render at the second pivot:
BUY label (bullish divergence):
Position: Below current swing low (label.style_label_up)
Text: "BUY"
Color: Matches bullish line color
Size: Normal (size.normal)
SELL label (bearish divergence):
Position: Above current swing high (label.style_label_down)
Text: "SELL"
Color: Matches bearish line color
Size: Normal (size.normal)
Labels can be toggled independently of lines via showLabels input.
═══════════════════════════════════════════
CONFIGURATION PARAMETERS
═══════════════════════════════════════════
RSI CALCULATION SETTINGS:
Price Source: close (configurable to any price field)
RSI Length: 14 (standard momentum window)
Volatility Band Length: 34 (SMA period for RSI basis)
Band Multiplier: 1.618 (standard deviation expansion)
Note: Bands calculate internally but don't plot (logic parity with panel)
DIVERGENCE DETECTION SETTINGS:
Pivot Left: 10 bars (left-side swing confirmation)
Pivot Right: 10 bars (right-side swing confirmation)
Overbought Level: 68 (reference, does not affect logic)
Oversold Level: 32 (reference, does not affect logic)
Pivot parameters control strictness:
Higher values = fewer, more significant divergences (requires wider swings)
Lower values = more frequent divergences (detects smaller swings)
VISUAL SETTINGS:
Show Divergence Lines: true/false toggle
Show BUY/SELL Labels: true/false toggle (independent of lines)
Line Width: 1-6 pixels
Bull Color: Configurable (default lime green)
Bear Color: Configurable (default red)
═══════════════════════════════════════════
ALERT SYSTEM
═══════════════════════════════════════════
Two alert conditions trigger at identical timing as visual signals:
"Bullish Divergence (Overlay)"
Triggers when: Bullish divergence confirms at second pivot
Timing: Fires AFTER Pivot Right bars complete (delayed but stable)
Message: "TDI: Bullish divergence"
Reliability: Never repaints (confirmation locked at rsi )
"Bearish Divergence (Overlay)"
Triggers when: Bearish divergence confirms at second pivot
Timing: Fires AFTER Pivot Right bars complete (delayed but stable)
Message: "TDI: Bearish divergence"
Reliability: Never repaints (confirmation locked at rsi )
Alert configuration:
Set once on any chart/timeframe
Fires only when divergence condition evaluates true
Synchronized with visual rendering (alert = line + label appear)
═══════════════════════════════════════════
TRADING IMPLEMENTATION
═══════════════════════════════════════════
VISUAL ANALYSIS WORKFLOW
The overlay provides direct price-level context for divergence signals:
Bullish divergence interpretation:
Identify two connected swing lows with upward-sloping line
Lower price low indicates selling pressure weakening
Higher RSI low indicates momentum refusing to confirm price weakness
BUY label marks the second swing low (divergence confirmation point)
Bearish divergence interpretation:
Identify two connected swing highs with downward-sloping line
Higher price high indicates buying pressure weakening
Lower RSI high indicates momentum refusing to confirm price strength
SELL label marks the second swing high (divergence confirmation point)
CONFLUENCE WITH PRICE STRUCTURE
Overlay enables direct correlation with chart elements:
Support/Resistance alignment:
Bullish divergence at major support level = higher probability reversal
Bearish divergence at major resistance level = higher probability reversal
Divergence in middle of range = lower conviction signal
Volume confirmation:
Divergence with decreasing volume = confirms momentum exhaustion
Divergence with increasing volume = mixed signal, proceed with caution
Multi-timeframe context:
Higher timeframe trend alignment increases signal reliability
Counter-trend divergences (against HTF trend) require additional confirmation
ENTRY/EXIT FRAMEWORK
The overlay marks divergence confirmation points, not entry triggers:
Entry consideration process:
Divergence line appears → structure-confirmed momentum divergence detected
Wait for price confirmation (engulfing candle, break of structure, rejection wick)
Validate with additional confluence (volume, support/resistance, HTF trend)
Enter with predefined stop below/above divergence pivot
Size position according to distance to invalidation level
Exit planning:
Initial target: Previous swing high (bullish) / swing low (bearish)
Trail stop: Move to breakeven after initial profit target
Invalidation: Close below divergence low (bullish) / above divergence high (bearish)
═══════════════════════════════════════════
PANEL VS OVERLAY USAGE
═══════════════════════════════════════════
IDENTICAL DETECTION LOGIC
Both versions implement the same pivot-locked RSI evaluation:
Same RSI calculation (14-length with 2-period RMA smoothing)
Same volatility band framework (34-SMA + 1.618σ)
Same pivot confirmation (10 Left + 10 Right)
Same divergence comparison (rsi at locked bar indices)
Result: Divergences trigger at identical bars across both implementations.
RENDERING DIFFERENCES
Panel version (overlay=false):
Renders in separate pane below price chart
Displays RSI line, volatility bands, 50-line midline
Divergence lines drawn in oscillator space (RSI value coordinates)
Optional Shark Fin exhaustion visualization
Labels positioned relative to RSI levels
Overlay version (overlay=true):
Renders directly on price chart
No RSI line or bands visible (calculate internally for logic only)
Divergence lines drawn in price space (actual price coordinates)
No Shark Fin visualization (price chart remains clean)
Labels positioned at actual swing high/low prices
COMPLEMENTARY WORKFLOW
Recommended usage pattern:
Panel version: Monitor RSI regime (above/below 50), band interactions, Shark Fin exhaustion
Overlay version: Identify exact divergence price levels, correlate with support/resistance
Combined analysis: Use panel for momentum context, overlay for entry/exit precision
Alternative workflow (overlay only):
If RSI analysis not required, overlay version provides clean divergence detection
Pair with external RSI indicator if separate momentum visualization needed
Focuses chart space on price action and divergence markers only
═══════════════════════════════════════════
TECHNICAL SPECIFICATIONS
═══════════════════════════════════════════
RESOURCE ALLOCATION:
max_lines_count: 500 (divergence connector lines)
max_labels_count: 500 (BUY/SELL markers)
Suitable for most chart configurations and timeframes
RENDERING STABILITY:
xloc.bar_index positioning ensures visual stability across zoom/pan operations
Historical divergences never move once printed
Lines and labels scale proportionally with chart transformations
TIMEFRAME COMPATIBILITY:
Functions on any timeframe (1m to 1M)
Pivot detection adapts to bar spacing automatically
Lower timeframes generate more frequent signals (smaller swings)
Higher timeframes generate fewer signals (larger swings)
SYMBOL COMPATIBILITY:
Works on all asset classes (stocks, forex, crypto, futures, indices)
No symbol-specific logic or calculations
Universal RSI-based divergence detection
PERFORMANCE CHARACTERISTICS:
Lightweight calculation overhead (RSI + pivot detection + state management)
Visual rendering occurs only on divergence confirmation (not every bar)
No continuous repainting or historical recalculation
═══════════════════════════════════════════
USE CASE SCENARIOS
═══════════════════════════════════════════
SCENARIO 1: Support/Resistance Divergence
Setup: Price tests major support level twice, second test makes lower low
Signal: Bullish divergence line appears, RSI makes higher low at support
Interpretation: Momentum refusing to confirm price weakness at critical level
Action: Consider long entry on next bullish candle above divergence low
SCENARIO 2: Trend Exhaustion
Setup: Strong uptrend, price makes new high but momentum slowing
Signal: Bearish divergence line appears, RSI makes lower high
Interpretation: Buying pressure weakening despite higher price high
Action: Consider profit-taking on longs, watch for reversal confirmation
SCENARIO 3: Range-Bound Reversal
Setup: Price oscillating in horizontal range, tests lower boundary
Signal: Bullish divergence at range support
Interpretation: Oversold bounce opportunity within defined range
Action: Long entry targeting range midpoint or upper boundary
SCENARIO 4: Failed Breakout
Setup: Price breaks resistance but momentum doesn't confirm
Signal: Bearish divergence forms immediately after breakout
Interpretation: Breakout lacks momentum conviction, likely false breakout
Action: Consider fade setup (short) with stop above divergence high
═══════════════════════════════════════════
LIMITATIONS & CONSIDERATIONS
═══════════════════════════════════════════
SIGNAL TIMING:
Divergences print AFTER Pivot Right bars complete. This delay is intentional:
Ensures structure confirmation (full swing formation)
Prevents real-time repaint issues
Trades confirmation reliability for signal speed
Users requiring instant signals should use real-time divergence detectors (with repaint risk).
Users requiring reliable, stable signals should accept the confirmation delay.
LINE CLUTTER:
On lower timeframes with sensitive pivot settings:
High signal frequency may create visual clutter
Solution: Increase Pivot Left/Right values to filter smaller swings
Alternative: Use panel version for primary analysis, overlay for key divergences only
FALSE SIGNALS:
Divergences indicate momentum divergence, not guaranteed reversals:
Strong trends can maintain divergent conditions for extended periods
Divergence in isolation is a warning sign, not a trade trigger
Requires confluence with price action, volume, structure for high-probability setups
VOLATILITY BAND CONTEXT:
Bands calculate internally but don't visualize on overlay:
Users lose visual context of RSI overbought/oversold zones
Solution: Use panel version alongside overlay for complete RSI regime awareness
Alternative: Add separate RSI indicator to chart for band visualization
═══════════════════════════════════════════
Smart Divergence Engine Overlay provides candle-anchored, repainting-proof RSI divergence visualization directly on price charts. Lines and labels render at exact pivot price levels using xloc.bar_index positioning, maintaining stability across all chart transformations. Divergence detection uses pivot-locked RSI evaluation (rsi ) to ensure historical signals never move or disappear.
The overlay shares identical detection logic with the panel version but renders in price space rather than oscillator space, enabling direct correlation with support/resistance levels and price structure. All visual elements trigger only after full pivot confirmation (Pivot Left + Pivot Right bars), trading signal speed for absolute reliability.

NQ Market DNA MapNQ Market DNA Map
The Market DNA Map indicator is designed to visualize key trading sessions (Asia, London, and New York) on the chart while providing a probabilistic lookup table based on historical session patterns. This tool draws session boxes with midline references, extends session highs and lows until mitigated or a daily hardstop (16:00 in the selected timezone), and displays a summary table with statistical metrics derived from predefined historical data. The data mappings are hardcoded, reflecting an analytical approach for session-based price action. Note that all probabilities and metrics are based on past observations and should not be interpreted as predictions or guarantees of future market behavior. These statistics are only tested and generated based on NQ futures. This indicator is for educational and informational purposes only; trading decisions should incorporate additional analysis and risk management.
Key Features
• Session Visualization:
o Draws colored boxes for the Asia, London, and New York sessions, updating in real-time as the session progresses.
o Includes a dotted midline within each box for quick reference to the session's midpoint.
o Extends horizontal lines from the final session high and low until price mitigates them (crossing both above and below) or the daily hardstop is reached.
• Probabilistic Table:
o A customizable-position table appears on the chart (once the New York open is detected), summarizing conditions and metrics for the current day's setup.
o Conditions include: Asia range relative to its rolling average, London open relative to Asia's midpoint, London sweep type (high only, low only, both, or none), and New York open relative to London's midpoint.
o Metrics displayed include:
First High Sweep %: Probability (based on historical data) that the high of the prior session is swept first during New York.
First Low Sweep %: Probability that the low is swept first.
Med Pen ↑ (High): Median penetration distance (in points) above the session high.
Med Pen ↓ (Low): Median penetration below the session low.
Fail High -> Low %: Failure rate where an initial high sweep fails and reverses to sweep the low.
Fail Low -> High %: Failure rate for an initial low sweep reversing to the high.
Sample Size: Number of historical observations for the matching pattern (n value), with a rating of "High" (n ≥ 150), "Mid" (n ≥ 75), or "Low" (n < 75) to indicate data reliability.
o The table uses color-coding for quick interpretation: Green for above-average/above-mid conditions, red for below, and neutral tones for metrics.
• Asia Range Ratio: Calculates a rolling average of Asia session ranges over a user-defined lookback period to classify the current Asia range as above or below average.
• Hardstop Logic: All extensions cease at 16:00 in the selected timezone to align with typical daily cycle resets.
Inputs and Customization
• Calculation Timezone: Select from predefined options (e.g., "America/New_York", "Europe/London") to align session times with your preferred market clock. Default: "America/New_York".
• Session Times:
o Asia Session: Default "2000-0200" (8:00 PM to 2:00 AM in the selected timezone).
o London Session: Default "0200-0800" (2:00 AM to 8:00 AM).
o NY Session: Default "0800-1600" (8:00 AM to 4:00 PM). These can be adjusted to match specific market hours or personal preferences.
• Asia Ratio Rolling Window: Integer lookback (default: 20) for calculating the average Asia session range ratio (range divided by open price).
• Table Position: Choose where the summary table appears on the chart (e.g., top_right, bottom_right). Default: top_right.
• Colors: Customizable box fill and border colors for each session (Asia: yellow tones, London: blue, NY: gray) with transparency settings for overlay compatibility.
How It Works
1. Session Detection: The indicator checks the current bar's time against user-defined sessions in the selected timezone. Sessions are non-overlapping and assume a 24-hour cycle.
2. Box and Line Drawing:
o At session start, a box is initialized from the open/high/low.
o As the session progresses, the box expands to capture the live high/low, with the midline updating dynamically.
o Upon session end, final high/low are locked, and extension lines are drawn horizontally.
o Extensions persist until price fully mitigates the level (high ≥ level and low ≤ level) or the hardstop time is passed.
3. Asia Ratio Calculation: Maintains a historical array of Asia range ratios (high-low divided by open). The current ratio is compared to the average over the lookback to classify as "Above Avg" or "Below Avg".
4. Key Generation and Lookup:
o A unique key is built from four binary/ternary codes: Asia classification (0/1), London open vs. Asia mid (0/1), London sweep type (0=high only, 1=low only, 2=both, 3=none), NY open vs. London mid (0/1).
o This key queries a hardcoded map of historical data (e.g., "0_0_0_0" for above-avg Asia, above-mid London open, high-only sweep, above-mid NY open).
o Data includes sample size, probabilities, failure rates, and median penetrations, all derived from historical analysis (total samples across all keys: approximately 5,000+ based on the provided mappings).
5. Table Rendering: On the last bar (real-time), the table populates with the current key's data. Metrics are formatted for readability, and penetration values are scaled to the current London high/low in points for context.
6. Performance Notes: The indicator uses up to 500 lines and boxes for extensions and visuals, ensuring compatibility with TradingView limits. It is overlay=true, so it plots directly on the price chart.
Data Source and Limitations
The probabilistic data is hardcoded and represents a compilation of historical session patterns from backtested or observed market behavior on NQ futures. Exact data collection methodology is not specified in the script, but values are presented as-is for illustrative purposes. Users should verify applicability to their specific symbol/timeframe, as markets evolve and past patterns may not repeat. Low-sample patterns (rated "Low") have higher uncertainty.
This indicator does not generate buy/sell signals, alerts, or trading strategies—it solely provides visual and statistical context. Always combine with other tools, fundamental analysis, and proper risk controls. Trading involves risk of loss; no performance guarantees are implied. If republishing or modifying, please credit the original structure and adhere to TradingView's publication guidelines. For questions on usage, refer to TradingView documentation on session indicators and probabilistic tools.

P6●智能资金概念交易系统//@version=5
indicator("P6●智能资金概念交易系统", overlay=true, max_boxes_count = 500, max_labels_count = 500)
// === 参数分类标题 ===
// --------------------------
// 1. 基础指标设置
// --------------------------
// 2. 范围过滤器 设置
// --------------------------
// 3. ADX 趋势过滤器 设置
// --------------------------
// 4. 趋势线 设置
// --------------------------
// 5. 支撑与阻力 设置
// --------------------------
// 6. PMA 设置
// --------------------------
// 7. 交易信息表格 设置
// --------------------------
// 8. 顶部规避 设置
// --------------------------
// 9. 底部规避 设置
// --------------------------
// 10. RSI 动量指标 设置
// --------------------------
// 11. 多时间框架 设置
// --------------------------
// === 显示/隐藏选项 ===
showRangeFilter = input.bool(true, title="显示 范围过滤器", group="1. 基础指标设置")
showADXFilter = input.bool(true, title="启用 ADX 趋势过滤器", group="1. 基础指标设置")
showTrendLines = input.bool(false, title="显示 趋势线", group="1. 基础指标设置")
showSupRes = input.bool(true, title="显示 支撑与阻力", group="1. 基础指标设置")
showPMA = input.bool(true, title="显示 多周期移动平均线", group="1. 基础指标设置")
showTable = input.bool(true, title="显示 交易信息表格", group="1. 基础指标设置")
showTopAvoidance = input.bool(false, title="启用 顶部规避系统", group="1. 基础指标设置")
showBottomAvoidance = input.bool(false, title="启用 底部规避系统", group="1. 基础指标设置")
showRSI = input.bool(false, title="启用 RSI 动量指标", group="1. 基础指标设置")
showMTF = input.bool(true, title="启用 多时间框架分析", group="1. 基础指标设置")
// === RSI 动量指标 设置 ===
rsiLength = input.int(14, title="RSI 周期", minval=1, group="10. RSI 动量指标 设置")
rsiOverbought = input.float(70.0, title="超买阈值", minval=50, maxval=90, step=1, group="10. RSI 动量指标 设置")
rsiOversold = input.float(30.0, title="超卖阈值", minval=10, maxval=50, step=1, group="10. RSI 动量指标 设置")
rsiNeutralUpper = input.float(60.0, title="中性区间上沿", minval=50, maxval=70, step=1, group="10. RSI 动量指标 设置")
rsiNeutralLower = input.float(40.0, title="中性区间下沿", minval=30, maxval=50, step=1, group="10. RSI 动量指标 设置")
// === 多时间框架设置 ===
mtfEnable1m = input.bool(true, title="启用 1分钟", group="11. 多时间框架 设置")
mtfEnable5m = input.bool(true, title="启用 5分钟", group="11. 多时间框架 设置")
mtfEnable15m = input.bool(true, title="启用 15分钟", group="11. 多时间框架 设置")
mtfEnable1h = input.bool(true, title="启用 1小时", group="11. 多时间框架 设置")
mtfEnable4h = input.bool(true, title="启用 4小时", group="11. 多时间框架 设置")
// === RSI 计算与状态判断 ===
rsiValue = ta.rsi(close, rsiLength)
rsiPrevious = ta.rsi(close , rsiLength)
// RSI 动量状态判断
getRSIStatus() =>
status = "动量中性"
// 动量回落条件:RSI从高位下降或处于下降趋势
fallCondition1 = rsiValue < rsiPrevious and rsiValue > rsiNeutralUpper
fallCondition2 = rsiValue >= rsiOverbought and rsiValue < rsiPrevious
fallCondition3 = rsiPrevious >= rsiOverbought and rsiValue < rsiOverbought and rsiValue < rsiPrevious
if fallCondition1 or fallCondition2 or fallCondition3
status := "动量回落"
// 动量回升条件:RSI从低位上升或处于上升趋势
riseCondition1 = rsiValue > rsiPrevious and rsiValue < rsiNeutralLower
riseCondition2 = rsiValue <= rsiOversold and rsiValue > rsiPrevious
riseCondition3 = rsiPrevious <= rsiOversold and rsiValue > rsiOversold and rsiValue > rsiPrevious
if riseCondition1 or riseCondition2 or riseCondition3
status := "动量回升"
// 动量中性条件:RSI在中性区间或无明确趋势
if rsiValue >= rsiNeutralLower and rsiValue <= rsiNeutralUpper
status := "动量中性"
status
rsiStatus = getRSIStatus()
// RSI 信号与其他指标结合
rsiSupportsBuy = rsiStatus == "动量回升" or (rsiValue <= rsiOversold and rsiValue > rsiPrevious)
rsiSupportssell = rsiStatus == "动量回落" or (rsiValue >= rsiOverbought and rsiValue < rsiPrevious)
// === 多时间框架数据获取 ===
// 简化的多时间框架趋势计算
calcSimpleTrend(src) =>
ema21 = ta.ema(src, 21)
ema50 = ta.ema(src, 50)
trend = src > ema21 and ema21 > ema50 ? 1 : src < ema21 and ema21 < ema50 ? -1 : 0
trend
// 获取各时间框架的趋势数据
trend1m = showMTF and mtfEnable1m ? request.security(syminfo.tickerid, "1", calcSimpleTrend(close)) : 0
trend5m = showMTF and mtfEnable5m ? request.security(syminfo.tickerid, "5", calcSimpleTrend(close)) : 0
trend15m = showMTF and mtfEnable15m ? request.security(syminfo.tickerid, "15", calcSimpleTrend(close)) : 0
trend1h = showMTF and mtfEnable1h ? request.security(syminfo.tickerid, "60", calcSimpleTrend(close)) : 0
trend4h = showMTF and mtfEnable4h ? request.security(syminfo.tickerid, "240", calcSimpleTrend(close)) : 0
// === 多时间框架趋势判断函数 ===
getTrendDirection(trend) =>
if trend > 0
"多头倾向"
else if trend < 0
"空头倾向"
else
"震荡"
// 获取各时间框架趋势方向
trend1mDir = getTrendDirection(trend1m)
trend5mDir = getTrendDirection(trend5m)
trend15mDir = getTrendDirection(trend15m)
trend1hDir = getTrendDirection(trend1h)
trend4hDir = getTrendDirection(trend4h)
// === 顶部规避系统 ===
ma_period_top = input.int(10, 'MA Period (Length)', group='8. 顶部规避 设置')
topThreshold = input.int(85, 'VAR顶部阈值', minval=70, maxval=95, step=1, group='8. 顶部规避 设置')
// 计算VAR指标 - 顶部(检测上涨动能)
pre_price_top = close
VAR_top = ta.sma(math.max(close-pre_price_top,0), ma_period_top) / ta.sma(math.abs(close-pre_price_top), ma_period_top) * 100
// 顶部信号 - 当上涨动能达到高位时
isTop = VAR_top > topThreshold and VAR_top <= topThreshold
// 图表显示顶部标记
plotshape(series=showTopAvoidance and isTop, title="顶", style=shape.labeldown, location=location.abovebar,
color=color.new(color.purple, 0), textcolor=color.white, size=size.normal, text="顶")
// === 底部规避系统 ===
ma_period_bottom = input.int(14, 'MA Period (Length)', group='9. 底部规避 设置')
bottomThreshold = input.int(15, 'VAR底部阈值', minval=5, maxval=30, step=1, group='9. 底部规避 设置')
// 计算VAR指标 - 底部(检测下跌动能)
pre_price_bottom = close
VAR_bottom = ta.sma(math.max(pre_price_bottom-close,0), ma_period_bottom) / ta.sma(math.abs(close-pre_price_bottom), ma_period_bottom) * 100
// 底部信号 - 当下跌动能达到高位时
isBottom = VAR_bottom > bottomThreshold and VAR_bottom <= bottomThreshold
// 图表显示底部标记
plotshape(series=showBottomAvoidance and isBottom, title="底", style=shape.labelup, location=location.belowbar,
color=color.new(color.orange, 0), textcolor=color.white, size=size.normal, text="底")
// === 范围过滤器 部分 ===
upColor = color.white
midColor = #90bff9
downColor = color.blue
src = input(defval=close, title="数据源", group="2. 范围过滤器 设置")
per = input.int(defval=100, minval=1, title="采样周期", group="2. 范围过滤器 设置")
mult = input.float(defval=3.0, minval=0.1, title="区间倍数", group="2. 范围过滤器 设置")
smoothrng(x, t, m) =>
wper = t * 2 - 1
avrng = ta.ema(math.abs(x - x ), t)
smoothrng = ta.ema(avrng, wper) * m
smoothrng
smrng = smoothrng(src, per, mult)
rngfilt(x, r) =>
rngfilt = x
rngfilt := x > nz(rngfilt ) ? x - r < nz(rngfilt ) ? nz(rngfilt ) : x - r :
x + r > nz(rngfilt ) ? nz(rngfilt ) : x + r
rngfilt
filt = rngfilt(src, smrng)
upward = 0.0
upward := filt > filt ? nz(upward ) + 1 : filt < filt ? 0 : nz(upward )
downward = 0.0
downward := filt < filt ? nz(downward ) + 1 : filt > filt ? 0 : nz(downward )
hband = filt + smrng
lband = filt - smrng
filtcolor = upward > 0 ? upColor : downward > 0 ? downColor : midColor
barcolor_ = src > filt and src > src and upward > 0 ? upColor :
src > filt and src < src and upward > 0 ? upColor :
src < filt and src < src and downward > 0 ? downColor :
src < filt and src > src and downward > 0 ? downColor : midColor
longCond = bool(na)
shortCond = bool(na)
longCond := src > filt and src > src and upward > 0 or
src > filt and src < src and upward > 0
shortCond := src < filt and src < src and downward > 0 or
src < filt and src > src and downward > 0
CondIni = 0
CondIni := longCond ? 1 : shortCond ? -1 : CondIni
// === ADX 趋势过滤器 部分 ===
adxLength = input.int(defval=14, minval=1, title="ADX 周期", group="3. ADX 趋势过滤器 设置")
adxThreshold = input.float(defval=25.0, minval=0, maxval=100, step=0.5, title="ADX 阈值", tooltip="ADX大于此值才允许交易信号", group="3. ADX 趋势过滤器 设置")
// 简化的ADX计算 - 更准确的方法
calcADX(len) =>
up = ta.change(high)
down = -ta.change(low)
plusDM = na(up) ? na : (up > down and up > 0 ? up : 0)
minusDM = na(down) ? na : (down > up and down > 0 ? down : 0)
truerange = ta.rma(ta.tr, len)
plus = fixnan(100 * ta.rma(plusDM, len) / truerange)
minus = fixnan(100 * ta.rma(minusDM, len) / truerange)
sum = plus + minus
adx = 100 * ta.rma(math.abs(plus - minus) / (sum == 0 ? 1 : sum), len)
= calcADX(adxLength)
// ADX状态判断
adxStrong = adxValue >= adxThreshold
adxTrendUp = diPlus > diMinus
adxTrendDown = diMinus > diPlus
// 修改信号生成逻辑,加入顶部和底部规避以及RSI确认
longCondition = longCond and CondIni == -1 and (not showADXFilter or adxStrong) and (not showTopAvoidance or not isTop) and (not showRSI or rsiSupportsBuy)
shortCondition = shortCond and CondIni == 1 and (not showADXFilter or adxStrong) and (not showBottomAvoidance or not isBottom) and (not showRSI or rsiSupportssell)
// === 记录买卖信号价格 ===
var float entryPrice = na
var string entryType = na
var float entryTime = na
// 当出现买入信号时记录
if longCondition
entryPrice := close
entryType := "多单"
entryTime := time
// 当出现卖出信号时记录
if shortCondition
entryPrice := close
entryType := "空单"
entryTime := time
// === 趋势颜色逻辑 ===
var trendColor = color.gray
if longCondition
trendColor := color.green
else if shortCondition
trendColor := color.red
// ADX线绘制(可选)- 已隐藏显示
adxColor = adxStrong ? (adxTrendUp ? color.green : color.red) : color.gray
// plot(showADXLine and showADXFilter ? adxValue : na, title="平均方向指数", color=adxColor, linewidth=1)
// hline(showADXLine and showADXFilter ? adxThreshold : na, title="ADX阈值线", color=color.yellow, linestyle=hline.style_dashed)
// 绘图部分 - 已隐藏线条显示,保留功能
// filtplot = plot(showRangeFilter ? filt : na, color=trendColor, linewidth=2, title="区间过滤器")
// hbandplot = plot(showRangeFilter ? hband : na, color=color.new(trendColor, 30), title="上轨线", linewidth=1)
// lbandplot = plot(showRangeFilter ? lband : na, color=color.new(trendColor, 30), title="下轨线", linewidth=1)
// barcolor(na) - 已隐藏K线颜色
plotshape(showRangeFilter and longCondition, title="买入信号", text="买", textcolor=color.white, style=shape.labelup, size=size.small, location=location.belowbar, color=color.new(color.green, 20))
plotshape(showRangeFilter and shortCondition, title="卖出信号", text="卖", textcolor=color.white, style=shape.labeldown, size=size.small, location=location.abovebar, color=color.new(color.red, 20))
// === 趋势线 部分 ===
length_tl = input.int(14, '分型回溯长度', group="4. 趋势线 设置")
mult_tl = input.float(1., '斜率系数', minval = 0, step = .1, group="4. 趋势线 设置")
calcMethod = input.string('平均真实波幅', '斜率计算方法', options = , group="4. 趋势线 设置")
backpaint = input(true, tooltip = '回溯显示:将可视元素向历史偏移,禁用后可查看实时信号。', group="4. 趋势线 设置")
upCss = input.color(color.teal, '上升趋势线颜色', group = "4. 趋势线 设置")
dnCss = input.color(color.red, '下降趋势线颜色', group = "4. 趋势线 设置")
showExt = input(true, '显示延长线', group="4. 趋势线 设置")
var upper_tl = 0.
var lower_tl = 0.
var slope_ph_tl = 0.
var slope_pl_tl = 0.
var offset_tl = backpaint ? length_tl : 0
n = bar_index
src_tl = close
ph = ta.pivothigh(length_tl, length_tl)
pl = ta.pivotlow(length_tl, length_tl)
slope = switch calcMethod
'平均真实波幅' => ta.atr(length_tl) / length_tl * mult_tl
'标准差' => ta.stdev(src_tl, length_tl) / length_tl * mult_tl
'线性回归' => math.abs(ta.sma(src_tl * n, length_tl) - ta.sma(src_tl, length_tl) * ta.sma(n, length_tl)) / ta.variance(n, length_tl) / 2 * mult_tl
slope_ph_tl := ph ? slope : slope_ph_tl
slope_pl_tl := pl ? slope : slope_pl_tl
upper_tl := ph ? ph : upper_tl - slope_ph_tl
lower_tl := pl ? pl : lower_tl + slope_pl_tl
var upos = 0
var dnos = 0
upos := ph ? 0 : close > upper_tl - slope_ph_tl * length_tl ? 1 : upos
dnos := pl ? 0 : close < lower_tl + slope_pl_tl * length_tl ? 1 : dnos
var uptl = line.new(na,na,na,na, color = upCss, style = line.style_dashed, extend = extend.right)
var dntl = line.new(na,na,na,na, color = dnCss, style = line.style_dashed, extend = extend.right)
if ph and showExt and showTrendLines
line.set_xy1(uptl, n-offset_tl, backpaint ? ph : upper_tl - slope_ph_tl * length_tl)
line.set_xy2(uptl, n-offset_tl+1, backpaint ? ph - slope : upper_tl - slope_ph_tl * (length_tl+1))
if pl and showExt and showTrendLines
line.set_xy1(dntl, n-offset_tl, backpaint ? pl : lower_tl + slope_pl_tl * length_tl)
line.set_xy2(dntl, n-offset_tl+1, backpaint ? pl + slope : lower_tl + slope_pl_tl * (length_tl+1))
plot(showTrendLines ? (backpaint ? upper_tl : upper_tl - slope_ph_tl * length_tl) : na, '上升趋势线', color = ph ? na : upCss, offset = -offset_tl)
plot(showTrendLines ? (backpaint ? lower_tl : lower_tl + slope_pl_tl * length_tl) : na, '下降趋势线', color = pl ? na : dnCss, offset = -offset_tl)
// 趋势线突破也需要ADX确认,并加入顶部和底部规避以及RSI确认
trendLineBuySignal = showTrendLines and upos > upos and (not showADXFilter or adxStrong) and (not showTopAvoidance or not isTop) and (not showRSI or rsiSupportsBuy)
trendLineSellSignal = showTrendLines and dnos > dnos and (not showADXFilter or adxStrong) and (not showBottomAvoidance or not isBottom) and (not showRSI or rsiSupportssell)
plotshape(trendLineBuySignal ? low : na, "上轨突破"
, shape.labelup
, location.absolute
, upCss
, text = "突"
, textcolor = color.white
, size = size.tiny)
plotshape(trendLineSellSignal ? high : na, "下轨突破"
, shape.labeldown
, location.absolute
, dnCss
, text = "突"
, textcolor = color.white
, size = size.tiny)
alertcondition(trendLineBuySignal, '上轨突破', '价格向上突破下趋势线')
alertcondition(trendLineSellSignal, '下轨突破', '价格向下突破上趋势线')
// === 支撑与阻力 部分 ===
g_sr = '5. 支撑与阻力'
g_c = '条件'
g_st = '样式'
t_r = 'K线确认:仅在K线收盘时生成警报(延后1根K线)。\n\n高点与低点:默认情况下,突破/回踩系统使用当前收盘价判断,选择高点与低点后将使用高低点判断条件,不再重绘,结果会不同。'
t_rv = '每当检测到潜在回踩时,指标会判断回踩事件即将发生。此输入用于设置在潜在回踩激活时,最大允许检测多少根K线。\n\n例如,出现潜在回踩标签时,该标签允许存在多少根K线以确认回踩?此功能防止回踩警报在10根K线后才触发导致不准确。'
input_lookback = input.int(defval = 20, title = '回溯区间', minval = 1, tooltip = '检测分型事件的K线数量。', group = g_sr)
input_retSince = input.int(defval = 2, title = '突破后K线数', minval = 1, tooltip = '突破后多少根K线内检测回踩。', group = g_sr)
input_retValid = input.int(defval = 2, title = '回踩检测限制', minval = 1, tooltip = t_rv, group = g_sr)
input_breakout = input.bool(defval = true, title = '显示突破', group = g_c)
input_retest = input.bool(defval = true, title = '显示回踩', group = g_c)
input_repType = input.string(defval = '开启', title = '重绘模式', options = , tooltip = t_r, group = g_c)
input_outL = input.string(defval = line.style_dotted, title = '边框样式', group = g_st, options = )
input_extend = input.string(defval = extend.none, title = '延长方向', group = g_st, options = )
input_labelType = input.string(defval = '详细', title = '标签类型', options = , group = g_st)
input_labelSize = input.string(defval = size.small, title = '标签大小', options = , group = g_st)
st_break_lb_co1 = input.color(defval = color.lime , title = '空头突破标签颜色' ,inline = 'st_break_lb_co', group = g_st)
st_break_lb_co2 = input.color(defval = color.new(color.lime,40) , title = '' ,inline = 'st_break_lb_co', group = g_st)
lg_break_lb_co1 = input.color(defval = color.red , title = '多头突破标签颜色' ,inline = 'lg_break_lb_co', group = g_st)
lg_break_lb_co2 = input.color(defval = color.new(color.red,40) , title = '' ,inline = 'lg_break_lb_co', group = g_st)
st_retest_lb_co1 = input.color(defval = color.lime , title = '空头回踩标签颜色' ,inline = 'st_retest_lb_col', group = g_st)
st_retest_lb_co2 = input.color(defval = color.new(color.lime,40) , title = '' ,inline = 'st_retest_lb_col', group = g_st)
lg_retest_lb_co1 = input.color(defval = color.red , title = '多头回踩标签颜色' ,inline = 'lg_retest_lb_co', group = g_st)
lg_retest_lb_co2 = input.color(defval = color.new(color.red,40) , title = '' ,inline = 'lg_retest_lb_co', group = g_st)
input_plColor1 = input.color(defval = color.lime, title = '支撑方框颜色', inline = 'pl_Color', group = g_st)
input_plColor2 = input.color(defval = color.new(color.lime,85), title = '', inline = 'pl_Color', group = g_st)
input_phColor1 = input.color(defval = color.red, title = '阻力方框颜色', inline = 'ph_Color', group = g_st)
input_phColor2 = input.color(defval = color.new(color.red,85), title = '', inline = 'ph_Color', group = g_st)
input_override = input.bool(defval = false, title = '自定义文字颜色', inline = '覆盖', group = g_st)
input_textColor = input.color(defval = color.white, title = '', inline = '覆盖', group = g_st)
bb = input_lookback
// 兼容label与英文选项
rTon = input_repType == '开启'
rTcc = input_repType == '关闭:K线确认'
rThv = input_repType == '关闭:高低点'
breakText = input_labelType == '简洁' ? '突' : '突破'
// 分型
rs_pl = fixnan(ta.pivotlow(low, bb, bb))
rs_ph = fixnan(ta.pivothigh(high, bb, bb))
// Box 高度
s_yLoc = low > low ? low : low
r_yLoc = high > high ? high : high
//-----------------------------------------------------------------------------
// 函数
//-----------------------------------------------------------------------------
drawBox(condition, y1, y2, color,bgcolor) =>
var box drawBox = na
if condition and showSupRes // 仅在显示开关打开时绘制
box.set_right(drawBox, bar_index - bb)
drawBox.set_extend(extend.none)
drawBox := box.new(bar_index - bb, y1, bar_index, y2, color, bgcolor = bgcolor, border_style = input_outL, extend = input_extend)
updateBox(box) =>
if barstate.isconfirmed and showSupRes
box.set_right(box, bar_index + 5)
breakLabel(y, txt_col,lb_col, style, textform) =>
if showSupRes
label.new(bar_index, y, textform, textcolor = input_override ? input_textColor : txt_col, style = style, color = lb_col, size = input_labelSize)
retestCondition(breakout, condition) =>
ta.barssince(na(breakout)) > input_retSince and condition
repaint(c1, c2, c3) => rTon ? c1 : rThv ? c2 : rTcc ? c3 : na
//-----------------------------------------------------------------------------
// 绘制与更新区间
//-----------------------------------------------------------------------------
= drawBox(ta.change(rs_pl), s_yLoc, rs_pl, input_plColor1,input_plColor2)
= drawBox(ta.change(rs_ph), rs_ph, r_yLoc, input_phColor1,input_phColor2)
sTop = box.get_top(sBox), rTop = box.get_top(rBox)
sBot = box.get_bottom(sBox), rBot = box.get_bottom(rBox)
if showSupRes
updateBox(sBox), updateBox(rBox)
//-----------------------------------------------------------------------------
// 突破事件 - 加入顶部和底部规避以及RSI确认
//-----------------------------------------------------------------------------
var bool sBreak = na
var bool rBreak = na
cu = repaint(ta.crossunder(close, box.get_bottom(sBox)), ta.crossunder(low, box.get_bottom(sBox)), ta.crossunder(close, box.get_bottom(sBox)) and barstate.isconfirmed)
co = repaint(ta.crossover(close, box.get_top(rBox)), ta.crossover(high, box.get_top(rBox)), ta.crossover(close, box.get_top(rBox)) and barstate.isconfirmed)
switch
cu and na(sBreak) and showSupRes and (not showADXFilter or adxStrong) and (not showBottomAvoidance or not isBottom) and (not showRSI or rsiSupportssell) =>
sBreak := true
if input_breakout
breakLabel(sBot, st_break_lb_co1,st_break_lb_co2, label.style_label_upper_right, breakText)
co and na(rBreak) and showSupRes and (not showADXFilter or adxStrong) and (not showTopAvoidance or not isTop) and (not showRSI or rsiSupportsBuy) =>
rBreak := true
if input_breakout
breakLabel(rTop, lg_break_lb_co1,lg_break_lb_co2, label.style_label_lower_right, breakText)
if ta.change(rs_pl) and showSupRes
if na(sBreak)
box.delete(sBox )
sBreak := na
if ta.change(rs_ph) and showSupRes
if na(rBreak)
box.delete(rBox )
rBreak := na
//-----------------------------------------------------------------------------
// 回踩事件
//-----------------------------------------------------------------------------
s1 = retestCondition(sBreak, high >= sTop and close <= sBot)
s2 = retestCondition(sBreak, high >= sTop and close >= sBot and close <= sTop)
s3 = retestCondition(sBreak, high >= sBot and high <= sTop)
s4 = retestCondition(sBreak, high >= sBot and high <= sTop and close < sBot)
r1 = retestCondition(rBreak, low <= rBot and close >= rTop)
r2 = retestCondition(rBreak, low <= rBot and close <= rTop and close >= rBot)
r3 = retestCondition(rBreak, low <= rTop and low >= rBot)
r4 = retestCondition(rBreak, low <= rTop and low >= rBot and close > rTop)
retestEvent(c1, c2, c3, c4, y1, y2, txt_col,lb_col, style, pType) =>
if input_retest and showSupRes
var bool retOccurred = na
retActive = c1 or c2 or c3 or c4
retEvent = retActive and not retActive
retValue = ta.valuewhen(retEvent, y1, 0)
if pType == 'ph' ? y2 < ta.valuewhen(retEvent, y2, 0) : y2 > ta.valuewhen(retEvent, y2, 0)
retEvent := retActive
retValue := ta.valuewhen(retEvent, y1, 0)
retSince = ta.barssince(retEvent)
var retLabel = array.new()
if retEvent
retOccurred := na
array.push(retLabel, label.new(bar_index - retSince, y2 , text = input_labelType == '简洁' ? '潜回' : '潜在回踩', color = lb_col, style = style, textcolor = input_override ? input_textColor : txt_col, size = input_labelSize))
if array.size(retLabel) == 2
label.delete(array.first(retLabel))
array.shift(retLabel)
retConditions = pType == 'ph' ? repaint(close >= retValue, high >= retValue, close >= retValue and barstate.isconfirmed) : repaint(close <= retValue, low <= retValue, close <= retValue and barstate.isconfirmed)
retValid = ta.barssince(retEvent) > 0 and ta.barssince(retEvent) <= input_retValid and retConditions and not retOccurred and (not showADXFilter or adxStrong) and (not showRSI or (pType == 'ph' ? rsiSupportsBuy : rsiSupportssell))
if retValid
label.new(bar_index - retSince, y2 , text = input_labelType == '简洁' ? '回' : '回踩', color = lb_col, style = style, textcolor = input_override ? input_textColor : txt_col, size = input_labelSize)
retOccurred := true
if retValid or ta.barssince(retEvent) > input_retValid
label.delete(array.first(retLabel))
if pType == 'ph' and ta.change(rs_ph) and retOccurred
box.set_right(rBox , bar_index - retSince)
retOccurred := na
if pType == 'pl' and ta.change(rs_pl) and retOccurred
box.set_right(sBox , bar_index - retSince)
retOccurred := na
else
= retestEvent(r1, r2, r3, r4, high, low, lg_retest_lb_co1,lg_retest_lb_co2, label.style_label_upper_left, 'ph')
= retestEvent(s1, s2, s3, s4, low, high, st_retest_lb_co1,st_retest_lb_co2, label.style_label_lower_left, 'pl')
//-----------------------------------------------------------------------------
// 警报
//-----------------------------------------------------------------------------
// 买卖信号警报条件
buySignal = showTrendLines and trendLineBuySignal
sellSignal = showTrendLines and trendLineSellSignal
// 添加买卖信号的警报条件
alertcondition(buySignal, title='买入信号', message='范围过滤器买入信号:上轨突破')
alertcondition(sellSignal, title='卖出信号', message='范围过滤器卖出信号:下轨突破')
alertcondition((showSupRes and ta.change(rs_pl)), '新支撑位')
alertcondition((showSupRes and ta.change(rs_ph)), '新阻力位')
alertcondition((showSupRes and ta.barssince(na(sBreak)) == 1), '支撑位突破')
alertcondition((showSupRes and ta.barssince(na(rBreak)) == 1), '阻力位突破')
alertcondition((showSupRes and sRetValid), '支撑位回踩')
alertcondition((showSupRes and sRetEvent), '潜在支撑回踩')
alertcondition((showSupRes and rRetValid), '阻力位回踩')
alertcondition((showSupRes and rRetEvent), '潜在阻力回踩')
AllAlerts(condition, message) =>
if condition and showSupRes
alert(message)
AllAlerts(ta.change(rs_pl), '新支撑位')
AllAlerts(ta.change(rs_ph), '新阻力位')
AllAlerts(ta.barssince(na(sBreak)) == 1, '支撑位突破')
AllAlerts(ta.barssince(na(rBreak)) == 1, '阻力位突破')
AllAlerts(sRetValid, '支撑位回踩')
AllAlerts(sRetEvent, '潜在支撑回踩')
AllAlerts(rRetValid, '阻力位回踩')
AllAlerts(rRetEvent, '潜在阻力回踩')
AllAlerts(buySignal, '买入信号:上轨突破')
AllAlerts(sellSignal, '卖出信号:下轨突破')
// === 多周期移动平均线 部分 ===
// === 公共函数 ===
strRoundValue(num) =>
strv = ''
if num >= 100000
strv := str.tostring(num/1000, '#千')
else if (num < 100000) and (num >= 100)
strv := str.tostring(num, '#')
else if (num < 100) and (num >= 1)
strv := str.tostring(num, '#.##')
else if (num < 1) and (num >= 0.01)
strv := str.tostring(num, '#.####')
else if (num < 0.01) and (num >= 0.0001)
strv := str.tostring(num, '#.######')
else if (num < 0.0001) and (num >= 0.000001)
strv := str.tostring(num, '#.########')
(strv)
defaultFunction(func, src, len, alma_offst, alma_sigma) =>
has_len = false
ma = ta.swma(close)
if func == '自适应移动平均'
ma := ta.alma(src, len, alma_offst, alma_sigma)
has_len := true
else if func == '指数移动平均'
ma := ta.ema(src, len)
has_len := true
else if func == '修正移动平均'
ma := ta.rma(src, len)
has_len := true
else if func == '简单移动平均'
ma := ta.sma(src, len)
has_len := true
else if func == '对称加权移动平均'
ma := ta.swma(src)
has_len := false
else if func == '成交量加权平均价'
ma := ta.vwap(src)
has_len := false
else if func == '成交量加权移动平均'
ma := ta.vwma(src, len)
has_len := true
else if func == '加权移动平均'
ma := ta.wma(src, len)
has_len := true
def_fn = input.string(title='默认移动平均线', defval='指数移动平均', options= , group="6. PMA 设置")
ma1_on = input.bool(inline='均线1', title='启用移动平均线1', defval=false, group="6. PMA 设置")
ma2_on = input.bool(inline='均线2', title='启用移动平均线2', defval=true, group="6. PMA 设置")
ma3_on = input.bool(inline='均线3', title='启用移动平均线3', defval=true, group="6. PMA 设置")
ma4_on = input.bool(inline='均线4', title='启用移动平均线4', defval=true, group="6. PMA 设置")
ma5_on = input.bool(inline='均线5', title='启用移动平均线5', defval=true, group="6. PMA 设置")
ma6_on = input.bool(inline='均线6', title='启用移动平均线6', defval=true, group="6. PMA 设置")
ma7_on = input.bool(inline='均线7', title='启用移动平均线7', defval=true, group="6. PMA 设置")
ma1_fn = input.string(inline='均线1', title='', defval='默认', options= , group="6. PMA 设置")
ma2_fn = input.string(inline='均线2', title='', defval='默认', options= , group="6. PMA 设置")
ma3_fn = input.string(inline='均线3', title='', defval='默认', options= , group="6. PMA 设置")
ma4_fn = input.string(inline='均线4', title='', defval='默认', options= , group="6. PMA 设置")
ma5_fn = input.string(inline='均线5', title='', defval='默认', options= , group="6. PMA 设置")
ma6_fn = input.string(inline='均线6', title='', defval='默认', options= , group="6. PMA 设置")
ma7_fn = input.string(inline='均线7', title='', defval='默认', options= , group="6. PMA 设置")
ma1_len = input.int(inline='均线1', title='', defval=12, minval=1, group="6. PMA 设置")
ma2_len = input.int(inline='均线2', title='', defval=144, minval=1, group="6. PMA 设置")
ma3_len = input.int(inline='均线3', title='', defval=169, minval=1, group="6. PMA 设置")
ma4_len = input.int(inline='均线4', title='', defval=288, minval=1, group="6. PMA 设置")
ma5_len = input.int(inline='均线5', title='', defval=338, minval=1, group="6. PMA 设置")
ma6_len = input.int(inline='均线6', title='', defval=576, minval=1, group="6. PMA 设置")
ma7_len = input.int(inline='均线7', title='', defval=676, minval=1, group="6. PMA 设置")
alma1_offst = input.float(group='均线1其他设置', inline='均线11', title='自适应偏移', defval=0.85, minval=-1, maxval=1, step=0.01)
alma1_sigma = input.float(group='均线1其他设置', inline='均线11', title=', 西格玛', defval=6, minval=0, maxval=100, step=0.01)
ma1_src = input.source(group='均线1其他设置', inline='均线12', title='数据源', defval=close)
ma1_plt_offst = input.int(group='均线1其他设置', inline='均线12', title=', 绘图偏移', defval=0, minval=-500, maxval=500)
alma2_offst = input.float(group='均线2其他设置', inline='均线21', title='自适应偏移', defval=0.85, minval=-1, maxval=1, step=0.01)
alma2_sigma = input.float(group='均线2其他设置', inline='均线21', title='西格玛', defval=6, minval=0, maxval=100, step=0.01)
ma2_src = input.source(group='均线2其他设置', inline='均线22', title='数据源', defval=close)
ma2_plt_offst = input.int(group='均线2其他设置', inline='均线22', title='绘图偏移', defval=0, minval=-500, maxval=500)
alma3_offst = input.float(group='均线3其他设置', inline='均线31', title='自适应偏移', defval=0.85, minval=-1, maxval=1, step=0.01)
alma3_sigma = input.float(group='均线3其他设置', inline='均线31', title='西格玛', defval=6, minval=0, maxval=100, step=0.01)
ma3_src = input.source(group='均线3其他设置', inline='均线32', title='数据源', defval=close)
ma3_plt_offst = input.int(group='均线3其他设置', inline='均线32', title='绘图偏移', defval=0, minval=-500, maxval=500)
alma4_offst = input.float(group='均线4其他设置', inline='均线41', title='自适应偏移', defval=0.85, minval=-1, maxval=1, step=0.01)
alma4_sigma = input.float(group='均线4其他设置', inline='均线41', title='西格玛', defval=6, minval=0, maxval=100, step=0.01)
ma4_src = input.source(group='均线4其他设置', inline='均线42', title='数据源', defval=close)
ma4_plt_offst = input.int(group='均线4其他设置', inline='均线42', title='绘图偏移', defval=0, minval=-500, maxval=500)
alma5_offst = input.float(group='均线5其他设置', inline='均线51', title='自适应偏移', defval=0.85, minval=-1, maxval=1, step=0.01)
alma5_sigma = input.float(group='均线5其他设置', inline='均线51', title='西格玛', defval=6, minval=0, maxval=100, step=0.01)
ma5_src = input.source(group='均线5其他设置', inline='均线52', title='数据源', defval=close)
ma5_plt_offst = input.int(group='均线5其他设置', inline='均线52', title='绘图偏移', defval=0, minval=-500, maxval=500)
alma6_offst = input.float(group='均线6其他设置', inline='均线61', title='自适应偏移', defval=0.85, minval=-1, maxval=1, step=0.01)
alma6_sigma = input.float(group='均线6其他设置', inline='均线61', title='西格玛', defval=6, minval=0, maxval=100, step=0.01)
ma6_src = input.source(group='均线6其他设置', inline='均线62', title='数据源', defval=close)
ma6_plt_offst = input.int(group='均线6其他设置', inline='均线62', title='绘图偏移', defval=0, minval=-500, maxval=500)
alma7_offst = input.float(group='均线7其他设置', inline='均线71', title='自适应偏移', defval=0.85, minval=-1, maxval=1, step=0.01)
alma7_sigma = input.float(group='均线7其他设置', inline='均线71', title='西格玛', defval=6, minval=0, maxval=100, step=0.01)
ma7_src = input.source(group='均线7其他设置', inline='均线72', title='数据源', defval=close)
ma7_plt_offst = input.int(group='均线7其他设置', inline='均线72', title='绘图偏移', defval=0, minval=-500, maxval=500)
fill_12_on = input.bool(title='启用均线1-2填充', defval=false, group="6. PMA 设置")
fill_23_on = input.bool(title='启用均线2-3填充', defval=true, group="6. PMA 设置")
fill_34_on = input.bool(title='启用均线3-4填充', defval=false, group="6. PMA 设置")
fill_45_on = input.bool(title='启用均线4-5填充', defval=true, group="6. PMA 设置")
fill_56_on = input.bool(title='启用均线5-6填充', defval=false, group="6. PMA 设置")
fill_67_on = input.bool(title='启用均线6-7填充', defval=true, group="6. PMA 设置")
// === 计算移动平均线 ===
= defaultFunction(def_fn, ma1_src, ma1_len, alma1_offst, alma1_sigma)
= defaultFunction(def_fn, ma2_src, ma2_len, alma2_offst, alma2_sigma)
= defaultFunction(def_fn, ma3_src, ma3_len, alma3_offst, alma3_sigma)
= defaultFunction(def_fn, ma4_src, ma4_len, alma4_offst, alma4_sigma)
= defaultFunction(def_fn, ma5_src, ma5_len, alma5_offst, alma5_sigma)
= defaultFunction(def_fn, ma6_src, ma6_len, alma6_offst, alma6_sigma)
= defaultFunction(def_fn, ma7_src, ma7_len, alma7_offst, alma7_sigma)
// === 均线类型切换 ===
if ma1_fn != '默认'
if ma1_fn == '自适应移动平均'
ma1 := ta.alma(ma1_src, ma1_len, alma1_offst, alma1_sigma)
ma1_has_len := true
else if ma1_fn == '指数移动平均'
ma1 := ta.ema(ma1_src, ma1_len)
ma1_has_len := true
else if ma1_fn == '修正移动平均'
ma1 := ta.rma(ma1_src, ma1_len)
ma1_has_len := true
else if ma1_fn == '简单移动平均'
ma1 := ta.sma(ma1_src, ma1_len)
ma1_has_len := true
else if ma1_fn == '对称加权移动平均'
ma1 := ta.swma(ma1_src)
ma1_has_len := false
else if ma1_fn == '成交量加权平均价'
ma1 := ta.vwap(ma1_src)
ma1_has_len := false
else if ma1_fn == '成交量加权移动平均'
ma1 := ta.vwma(ma1_src, ma1_len)
ma1_has_len := true
else if ma1_fn == '加权移动平均'
ma1 := ta.wma(ma1_src, ma1_len)
ma1_has_len := true
if ma2_fn != '默认'
if ma2_fn == '自适应移动平均'
ma2 := ta.alma(ma2_src, ma2_len, alma2_offst, alma2_sigma)
ma2_has_len := true
else if ma2_fn == '指数移动平均'
ma2 := ta.ema(ma2_src, ma2_len)
ma2_has_len := true
else if ma2_fn == '修正移动平均'
ma2 := ta.rma(ma2_src, ma2_len)
ma2_has_len := true
else if ma2_fn == '简单移动平均'
ma2 := ta.sma(ma2_src, ma2_len)
ma2_has_len := true
else if ma2_fn == '对称加权移动平均'
ma2 := ta.swma(ma2_src)
ma2_has_len := false
else if ma2_fn == '成交量加权平均价'
ma2 := ta.vwap(ma2_src)
ma2_has_len := false
else if ma2_fn == '成交量加权移动平均'
ma2 := ta.vwma(ma2_src, ma2_len)
ma2_has_len := true
else if ma2_fn == '加权移动平均'
ma2 := ta.wma(ma2_src, ma2_len)
ma2_has_len := true
if ma3_fn != '默认'
if ma3_fn == '自适应移动平均'
ma3 := ta.alma(ma3_src, ma3_len, alma3_offst, alma3_sigma)
ma3_has_len := true
else if ma3_fn == '指数移动平均'
ma3 := ta.ema(ma3_src, ma3_len)
ma3_has_len := true
else if ma3_fn == '修正移动平均'
ma3 := ta.rma(ma3_src, ma3_len)
ma3_has_len := true
else if ma3_fn == '简单移动平均'
ma3 := ta.sma(ma3_src, ma3_len)
ma3_has_len := true
else if ma3_fn == '对称加权移动平均'
ma3 := ta.swma(ma3_src)
ma3_has_len := false
else if ma3_fn == '成交量加权平均价'
ma3 := ta.vwap(ma3_src)
ma3_has_len := false
else if ma3_fn == '成交量加权移动平均'
ma3 := ta.vwma(ma3_src, ma3_len)
ma3_has_len := true
else if ma3_fn == '加权移动平均'
ma3 := ta.wma(ma3_src, ma3_len)
ma3_has_len := true
if ma4_fn != '默认'
if ma4_fn == '自适应移动平均'
ma4 := ta.alma(ma4_src, ma4_len, alma4_offst, alma4_sigma)
ma4_has_len := true
else if ma4_fn == '指数移动平均'
ma4 := ta.ema(ma4_src, ma4_len)
ma4_has_len := true
else if ma4_fn == '修正移动平均'
ma4 := ta.rma(ma4_src, ma4_len)
ma4_has_len := true
else if ma4_fn == '简单移动平均'
ma4 := ta.sma(ma4_src, ma4_len)
ma4_has_len := true
else if ma4_fn == '对称加权移动平均'
ma4 := ta.swma(ma4_src)
ma4_has_len := false
else if ma4_fn == '成交量加权平均价'
ma4 := ta.vwap(ma4_src)
ma4_has_len := false
else if ma4_fn == '成交量加权移动平均'
ma4 := ta.vwma(ma4_src, ma4_len)
ma4_has_len := true
else if ma4_fn == '加权移动平均'
ma4 := ta.wma(ma4_src, ma4_len)
ma4_has_len := true
if ma5_fn != '默认'
if ma5_fn == '自适应移动平均'
ma5 := ta.alma(ma5_src, ma5_len, alma5_offst, alma5_sigma)
ma5_has_len := true
else if ma5_fn == '指数移动平均'
ma5 := ta.ema(ma5_src, ma5_len)
ma5_has_len := true
else if ma5_fn == '修正移动平均'
ma5 := ta.rma(ma5_src, ma5_len)
ma5_has_len := true
else if ma5_fn == '简单移动平均'
ma5 := ta.sma(ma5_src, ma5_len)
ma5_has_len := true
else if ma5_fn == '对称加权移动平均'
ma5 := ta.swma(ma5_src)
ma5_has_len := false
else if ma5_fn == '成交量加权平均价'
ma5 := ta.vwap(ma5_src)
ma5_has_len := false
else if ma5_fn == '成交量加权移动平均'
ma5 := ta.vwma(ma5_src, ma5_len)
ma5_has_len := true
else if ma5_fn == '加权移动平均'
ma5 := ta.wma(ma5_src, ma5_len)
ma5_has_len := true
if ma6_fn != '默认'
if ma6_fn == '自适应移动平均'
ma6 := ta.alma(ma6_src, ma6_len, alma6_offst, alma6_sigma)
ma6_has_len := true
else if ma6_fn == '指数移动平均'
ma6 := ta.ema(ma6_src, ma6_len)
ma6_has_len := true
else if ma6_fn == '修正移动平均'
ma6 := ta.rma(ma6_src, ma6_len)
ma6_has_len := true
else if ma6_fn == '简单移动平均'
ma6 := ta.sma(ma6_src, ma6_len)
ma6_has_len := true
else if ma6_fn == '对称加权移动平均'
ma6 := ta.swma(ma6_src)
ma6_has_len := false
else if ma6_fn == '成交量加权平均价'
ma6 := ta.vwap(ma6_src)
ma6_has_len := false
else if ma6_fn == '成交量加权移动平均'
ma6 := ta.vwma(ma6_src, ma6_len)
ma6_has_len := true
else if ma6_fn == '加权移动平均'
ma6 := ta.wma(ma6_src, ma6_len)
ma6_has_len := true
if ma7_fn != '默认'
if ma7_fn == '自适应移动平均'
ma7 := ta.alma(ma7_src, ma7_len, alma7_offst, alma7_sigma)
ma7_has_len := true
else if ma7_fn == '指数移动平均'
ma7 := ta.ema(ma7_src, ma7_len)
ma7_has_len := true
else if ma7_fn == '修正移动平均'
ma7 := ta.rma(ma7_src, ma7_len)
ma7_has_len := true
else if ma7_fn == '简单移动平均'
ma7 := ta.sma(ma7_src, ma7_len)
ma7_has_len := true
else if ma7_fn == '对称加权移动平均'
ma7 := ta.swma(ma7_src)
ma7_has_len := false
else if ma7_fn == '成交量加权平均价'
ma7 := ta.vwap(ma7_src)
ma7_has_len := false
else if ma7_fn == '成交量加权移动平均'
ma7 := ta.vwma(ma7_src, ma7_len)
ma7_has_len := true
else if ma7_fn == '加权移动平均'
ma7 := ta.wma(ma7_src, ma7_len)
ma7_has_len := true
// === 均线颜色 ===
ma1_clr = color.new(color.fuchsia, 0)
ma2_clr = color.new(color.aqua, 0)
ma3_clr = color.new(color.yellow, 0)
ma4_clr = color.new(color.blue, 0)
ma5_clr = color.new(color.orange, 0)
ma6_clr = color.new(color.green, 0)
ma7_clr = color.new(color.red, 0)
// === 均线全局绘图 ===
p1 = plot(series=showPMA and ma1_on ? ma1 : na, title="均线1", color=ma1_clr, trackprice=false, offset=ma1_plt_offst, linewidth=2)
p2 = plot(series=showPMA and ma2_on ? ma2 : na, title="均线2", color=ma2_clr, trackprice=false, offset=ma2_plt_offst, linewidth=2)
p3 = plot(series=showPMA and ma3_on ? ma3 : na, title="均线3", color=ma3_clr, trackprice=false, offset=ma3_plt_offst, linewidth=2)
p4 = plot(series=showPMA and ma4_on ? ma4 : na, title="均线4", color=ma4_clr, trackprice=false, offset=ma4_plt_offst, linewidth=2)
p5 = plot(series=showPMA and ma5_on ? ma5 : na, title="均线5", color=ma5_clr, trackprice=false, offset=ma5_plt_offst, linewidth=2)
p6 = plot(series=showPMA and ma6_on ? ma6 : na, title="均线6", color=ma6_clr, trackprice=false, offset=ma6_plt_offst, linewidth=2)
p7 = plot(series=showPMA and ma7_on ? ma7 : na, title="均线7", color=ma7_clr, trackprice=false, offset=ma7_plt_offst, linewidth=2)
// === 多周期移动平均线 填充渲染 ===
fill(p1, p2, color=showPMA and ma1_on and ma2_on and fill_12_on ? color.new(color.purple, 70) : na, title="均线1-2填充")
fill(p2, p3, color=showPMA and ma2_on and ma3_on and fill_23_on ? color.new(color.blue, 70) : na, title="均线2-3填充")
fill(p3, p4, color=showPMA and ma3_on and ma4_on and fill_34_on ? color.new(color.teal, 70) : na, title="均线3-4填充")
fill(p4, p5, color=showPMA and ma4_on and ma5_on and fill_45_on ? color.new(color.green, 70) : na, title="均线4-5填充")
fill(p5, p6, color=showPMA and ma5_on and ma6_on and fill_56_on ? color.new(color.yellow, 70) : na, title="均线5-6填充")
fill(p6, p7, color=showPMA and ma6_on and ma7_on and fill_67_on ? color.new(color.orange, 70) : na, title="均线6-7填充")
// === 交易信息表格 部分 ===
// 表格参数设置 - 修改默认大小为中等
tablePos = input.string("右上角", title="表格位置", options= , group="7. 交易信息表格 设置")
tableSize = input.string("中等", title="表格大小", options= , group="7. 交易信息表格 设置")
showTargets = input.bool(true, title="显示止盈目标", group="7. 交易信息表格 设置")
showRatio = input.bool(true, title="显示盈亏比", group="7. 交易信息表格 设置")
// 辅助函数
getTablePosition() =>
switch tablePos
"右上角" => position.top_right
"右下角" => position.bottom_right
"左上角" => position.top_left
"左下角" => position.bottom_left
getTableSize() =>
switch tableSize
"小" => size.small
"中等" => size.normal
"大" => size.large
formatPrice(price) =>
if na(price)
"N/A"
else
str.tostring(price, "#.####")
calcStopLossPercentage(entryPrice, stopLoss, entryType) =>
if na(entryPrice) or na(stopLoss) or na(entryType)
""
else
pct = 0.0
if entryType == "多单"
pct := (stopLoss - entryPrice) / entryPrice * 100
else if entryType == "空单"
pct := (entryPrice - stopLoss) / entryPrice * 100
" (" + str.tostring(pct, "#.##") + "%)"
calcTakeProfitPercentage(entryPrice, takeProfit, entryType) =>
if na(entryPrice) or na(takeProfit) or na(entryType)
""
else
pct = 0.0
if entryType == "多单"
pct := (takeProfit - entryPrice) / entryPrice * 100
else if entryType == "空单"
pct := (entryPrice - takeProfit) / entryPrice * 100
" (+" + str.tostring(pct, "#.##") + "%)"
calcUnrealizedPnL(entryPrice, currentPrice, entryType) =>
if na(entryPrice) or na(currentPrice) or na(entryType)
""
else
priceDiff = currentPrice - entryPrice
pct = (currentPrice - entryPrice) / entryPrice * 100
if entryType == "多单"
if pct > 0
" (" + formatPrice(priceDiff) + ", +" + str.tostring(pct, "#.##") + "%)"
else
" (" + formatPrice(priceDiff) + ", " + str.tostring(pct, "#.##") + "%)"
else if entryType == "空单"
// 对于空单,价差符号相反
if pct < 0
" (" + formatPrice(-priceDiff) + ", +" + str.tostring(-pct, "#.##") + "%)"
else
" (" + formatPrice(-priceDiff) + ", " + str.tostring(-pct, "#.##") + "%)"
else
""
// RSI状态颜色函数
getRSIStatusColor() =>
switch rsiStatus
"动量回升" => // 绿色
"动量回落" => // 红色
"动量中性" => // 黄色
=> // 默认灰色
// 多时间框架趋势颜色函数
getTrendColor(trendDirection) =>
switch trendDirection
"多头倾向" => // 绿色
"空头倾向" => // 红色
"震荡" => // 黄色
=> // 默认灰色
// === 蓝紫科幻风格表格 ===
// 创建蓝紫色主题的表格
var infoTable = table.new(getTablePosition(), columns=2, rows=26,
bgcolor=color.new(#0f0a1a, 5),
border_width=3,
border_color=color.new(#6633ff, 40),
frame_width=2,
frame_color=color.new(#9966ff, 30))
if showTable and barstate.islast
// 确定止盈止损位
var float stopLoss = na
var float takeProfit1 = na
var float takeProfit2 = na
if not na(entryType)
if entryType == "多单"
stopLoss := na(sBot) ? entryPrice * 0.98 : sBot
takeProfit1 := na(rTop) ? entryPrice * 1.02 : rTop
takeProfit2 := entryPrice * 1.05
else if entryType == "空单"
stopLoss := na(rTop) ? entryPrice * 1.02 : rTop
takeProfit1 := na(sBot) ? entryPrice * 0.98 : sBot
takeProfit2 := entryPrice * 0.95
// 计算盈亏比
riskRewardRatio = na(entryPrice) or na(stopLoss) or na(takeProfit1) ? na :
math.abs(takeProfit1 - entryPrice) / math.abs(entryPrice - stopLoss)
riskRewardStr = na(riskRewardRatio) ? "N/A" : "1:" + str.tostring(riskRewardRatio, "#.##")
rowIndex = 0
// === 作者联系信息行 - 最顶部,大字体 ===
table.cell(infoTable, 0, rowIndex, "合作联系作者", text_color=color.new(#ffcc99, 0),
text_size=size.normal, bgcolor=color.new(#1a1a0d, 0))
table.cell(infoTable, 1, rowIndex, "qq2390107445", text_color=color.new(#66ff99, 0),
text_size=size.normal, bgcolor=color.new(#0d2619, 0))
rowIndex += 1
// === 表格标题行 - 蓝紫主题 ===
table.cell(infoTable, 0, rowIndex, "⚡ P6●智能资金概念交易系统", text_color=color.new(#ccccff, 0),
text_size=getTableSize(), bgcolor=color.new(#1a0d33, 0))
table.cell(infoTable, 1, rowIndex, "『" + syminfo.ticker + "』", text_color=color.new(#9966ff, 0),
text_size=size.normal, bgcolor=color.new(#1a0d33, 0))
rowIndex += 1
// === 当前价格与浮盈浮亏行 - 蓝紫主题 ===
unrealizedPnL = calcUnrealizedPnL(entryPrice, close, entryType)
// 浮盈浮亏颜色逻辑
pnlColor = color.new(#ccccff, 0)
pnlBgColor = color.new(#0d0d1a, 0)
if not na(entryPrice)
if entryType == "多单"
if close > entryPrice
pnlColor := color.new(#66ff99, 0)
pnlBgColor := color.new(#0d2619, 0)
else
pnlColor := color.new(#ff6699, 0)
pnlBgColor := color.new(#260d19, 0)
else if entryType == "空单"
if close < entryPrice
pnlColor := color.new(#66ff99, 0)
pnlBgColor := color.new(#0d2619, 0)
else
pnlColor := color.new(#ff6699, 0)
pnlBgColor := color.new(#260d19, 0)
table.cell(infoTable, 0, rowIndex, "当前价格", text_color=color.new(#b3b3ff, 0),
text_size=getTableSize(), bgcolor=color.new(#0d0d1a, 0))
table.cell(infoTable, 1, rowIndex, formatPrice(close) + unrealizedPnL,
text_color=pnlColor,
text_size=getTableSize(), bgcolor=pnlBgColor)
rowIndex += 1
// === 趋势状态与进场价格行 - 蓝紫主题 ===
trendStatus = na(entryType) ? "待机中" : entryType == "多单" ? "多头执行" : "空头执行"
trendIcon = entryType == "多单" ? " ▲" : entryType == "空单" ? " ▼" : " ●"
trendBgColor = entryType == "多单" ? color.new(#1a4d1a, 0) :
entryType == "空单" ? color.new(#4d1a1a, 0) :
color.new(#1a1a4d, 0)
trendTextColor = entryType == "多单" ? color.new(#66ff99, 0) :
entryType == "空单" ? color.new(#ff6699, 0) :
color.new(#9999ff, 0)
table.cell(infoTable, 0, rowIndex, "交易状态", text_color=color.new(#b3b3ff, 0),
text_size=getTableSize(), bgcolor=color.new(#0d0d1a, 0))
table.cell(infoTable, 1, rowIndex, trendStatus + trendIcon, text_color=trendTextColor,
text_size=getTableSize(), bgcolor=trendBgColor)
rowIndex += 1
// === 进场价格行 - 蓝紫主题 ===
table.cell(infoTable, 0, rowIndex, "进场价位", text_color=color.new(#b3b3ff, 0),
text_size=getTableSize(), bgcolor=color.new(#0d0d1a, 0))
table.cell(infoTable, 1, rowIndex, formatPrice(entryPrice),
text_color=color.new(#ffcc99, 0),
text_size=getTableSize(), bgcolor=color.new(#1a1a0d, 0))
rowIndex += 1
// === 多时间框架分析 - 独立行显示 ===
if showMTF
// 多时间框架标题行
table.cell(infoTable, 0, rowIndex, "━━ 多时间框架趋势 ━━", text_color=color.new(#ccccff, 0),
text_size=getTableSize(), bgcolor=color.new(#1a0d33, 0))
table.cell(infoTable, 1, rowIndex, "━━━━━━━━━━━━━━━━━━━━", text_color=color.new(#6633ff, 0),
text_size=getTableSize(), bgcolor=color.new(#1a0d33, 0))
rowIndex += 1
// 1分钟趋势
if mtfEnable1m
= getTrendColor(trend1mDir)
trend1mIcon = trend1mDir == "多头倾向" ? " ▲" : trend1mDir == "空头倾向" ? " ▼" : " ●"
table.cell(infoTable, 0, rowIndex, "1分钟", text_color=color.new(#b3b3ff, 0),
text_size=getTableSize(), bgcolor=color.new(#0d0d1a, 0))
table.cell(infoTable, 1, rowIndex, trend1mDir + trend1mIcon, text_color=trend1mTextColor,
text_size=getTableSize(), bgcolor=trend1mBgColor)
rowIndex += 1
// 5分钟趋势
if mtfEnable5m
= getTrendColor(trend5mDir)
trend5mIcon = trend5mDir == "多头倾向" ? " ▲" : trend5mDir == "空头倾向" ? " ▼" : " ●"
table.cell(infoTable, 0, rowIndex, "5分钟", text_color=color.new(#b3b3ff, 0),
text_size=getTableSize(), bgcolor=color.new(#0d0d1a, 0))
table.cell(infoTable, 1, rowIndex, trend5mDir + trend5mIcon, text_color=trend5mTextColor,
text_size=getTableSize(), bgcolor=trend5mBgColor)
rowIndex += 1
// 15分钟趋势
if mtfEnable15m
= getTrendColor(trend15mDir)
trend15mIcon = trend15mDir == "多头倾向" ? " ▲" : trend15mDir == "空头倾向" ? " ▼" : " ●"
table.cell(infoTable, 0, rowIndex, "15分钟", text_color=color.new(#b3b3ff, 0),
text_size=getTableSize(), bgcolor=color.new(#0d0d1a, 0))
table.cell(infoTable, 1, rowIndex, trend15mDir + trend15mIcon, text_color=trend15mTextColor,
text_size=getTableSize(), bgcolor=trend15mBgColor)
rowIndex += 1
// 1小时趋势
if mtfEnable1h
= getTrendColor(trend1hDir)
trend1hIcon = trend1hDir == "多头倾向" ? " ▲" : trend1hDir == "空头倾向" ? " ▼" : " ●"
table.cell(infoTable, 0, rowIndex, "1小时", text_color=color.new(#b3b3ff, 0),
text_size=getTableSize(), bgcolor=color.new(#0d0d1a, 0))
table.cell(infoTable, 1, rowIndex, trend1hDir + trend1hIcon, text_color=trend1hTextColor,
text_size=getTableSize(), bgcolor=trend1hBgColor)
rowIndex += 1
// 4小时趋势
if mtfEnable4h
= getTrendColor(trend4hDir)
trend4hIcon = trend4hDir == "多头倾向" ? " ▲" : trend4hDir == "空头倾向" ? " ▼" : " ●"
table.cell(infoTable, 0, rowIndex, "4小时", text_color=color.new(#b3b3ff, 0),
text_size=getTableSize(), bgcolor=color.new(#0d0d1a, 0))
table.cell(infoTable, 1, rowIndex, trend4hDir + trend4hIcon, text_color=trend4hTextColor,
text_size=getTableSize(), bgcolor=trend4hBgColor)
rowIndex += 1
// === RSI 动量状态行 - 蓝紫主题 ===
rsiTextColor = color.new(#ccccff, 0)
rsiBgColor = color.new(#0d0d1a, 0)
if rsiStatus == "动量回升"
rsiTextColor := color.new(#66ff99, 0)
rsiBgColor := color.new(#0d2619, 0)
else if rsiStatus == "动量回落"
rsiTextColor := color.new(#ff6699, 0)
rsiBgColor := color.new(#260d19, 0)
else
rsiTextColor := color.new(#ffcc99, 0)
rsiBgColor := color.new(#1a1a0d, 0)
rsiIcon = rsiStatus == "动量回升" ? " ▲" : rsiStatus == "动量回落" ? " ▼" : " ●"
rsiDisplayText = rsiStatus + rsiIcon + " (" + str.tostring(rsiValue, "#.#") + ")"
table.cell(infoTable, 0, rowIndex, "RSI动量", text_color=color.new(#b3b3ff, 0),
text_size=getTableSize(), bgcolor=color.new(#0d0d1a, 0))
table.cell(infoTable, 1, rowIndex, rsiDisplayText, text_color=rsiTextColor,
text_size=getTableSize(), bgcolor=rsiBgColor)
rowIndex += 1
// === 风险管理分割线 ===
table.cell(infoTable, 0, rowIndex, "━━ 风险管理 ━━", text_color=color.new(#ccccff, 0),
text_size=getTableSize(), bgcolor=color.new(#1a0d33, 0))
table.cell(infoTable, 1, rowIndex, "━━━━━━━━━━━━━━━━━━━━", text_color=color.new(#6633ff, 0),
text_size=getTableSize(), bgcolor=color.new(#1a0d33, 0))
rowIndex += 1
// === 止损行 - 蓝紫主题 ===
slPct = calcStopLossPercentage(entryPrice, stopLoss, entryType)
table.cell(infoTable, 0, rowIndex, "止损价位", text_color=color.new(#b3b3ff, 0),
text_size=getTableSize(), bgcolor=color.new(#0d0d1a, 0))
table.cell(infoTable, 1, rowIndex, formatPrice(stopLoss) + slPct,
text_color=color.new(#ff6699, 0),
text_size=getTableSize(), bgcolor=color.new(#330d1a, 0))
rowIndex += 1
// 止盈目标行
if showTargets
// === 目标位1 - 蓝紫主题 ===
tp1Pct = calcTakeProfitPercentage(entryPrice, takeProfit1, entryType)
tp1Reached = na(takeProfit1) ? false :
(entryType == "多单" ? high >= takeProfit1 : low <= takeProfit1)
tp1Icon = tp1Reached ? " ✓" : ""
tp1Color = tp1Reached ? color.new(#66ff99, 0) : color.new(#99ccff, 0)
tp1BgColor = tp1Reached ? color.new(#0d2619, 0) : color.new(#0d1a26, 0)
table.cell(infoTable, 0, rowIndex, "止盈目标1", text_color=color.new(#b3b3ff, 0),
text_size=getTableSize(), bgcolor=color.new(#0d0d1a, 0))
table.cell(infoTable, 1, rowIndex, formatPrice(takeProfit1) + tp1Pct + tp1Icon,
text_color=tp1Color,
text_size=getTableSize(), bgcolor=tp1BgColor)
rowIndex += 1
// === 目标2 - 蓝紫主题 ===
tp2Pct = calcTakeProfitPercentage(entryPrice, takeProfit2, entryType)
tp2Reached = na(takeProfit2) ? false :
(entryType == "多单" ? high >= takeProfit2 : low <= takeProfit2)
tp2Icon = tp2Reached ? " ✓" : ""
tp2Color = tp2Reached ? color.new(#66ff99, 0) : color.new(#cc99ff, 0)
tp2BgColor = tp2Reached ? color.new(#0d2619, 0) : color.new(#1a0d26, 0)
table.cell(infoTable, 0, rowIndex, "止盈目标2", text_color=color.new(#b3b3ff, 0),
text_size=getTableSize(), bgcolor=color.new(#0d0d1a, 0))
table.cell(infoTable, 1, rowIndex, formatPrice(takeProfit2) + tp2Pct + tp2Icon,
text_color=tp2Color,
text_size=getTableSize(), bgcolor=tp2BgColor)
rowIndex += 1
// === 盈亏比行 - 蓝紫主题 ===
if showRatio
rrColor = color.new(#9999ff, 0)
rrBgColor = color.new(#0d0d1a, 0)
if not na(riskRewardRatio)
if riskRewardRatio >= 2
rrColor := color.new(#66ff99, 0)
rrBgColor := color.new(#0d2619, 0)
else if riskRewardRatio >= 1
rrColor := color.new(#ffcc99, 0)
rrBgColor := color.new(#1a1a0d, 0)
else
rrColor := color.new(#ff9966, 0)
rrBgColor := color.new(#1a1a0d, 0)
table.cell(infoTable, 0, rowIndex, "盈亏比例", text_color=color.new(#b3b3ff, 0),
text_size=getTableSize(), bgcolor=color.new(#0d0d1a, 0))
table.cell(infoTable, 1, rowIndex, riskRewardStr,
text_color=rrColor,
text_size=getTableSize(), bgcolor=rrBgColor)
rowIndex += 1
// === 免责声明行 - 蓝紫主题 ===
table.cell(infoTable, 0, rowIndex, "⚠ 风险提示", text_color=color.new(#9999ff, 0),
text_size=size.small, bgcolor=color.new(#0d0d1a, 0))
table.cell(infoTable, 1, rowIndex, "仅供参考,不构成投资建议,盈亏自负",
text_color=color.new(#9999ff, 0),
text_size=size.small, bgcolor=color.new(#1a1a4d, 0))

ICT订单块交易【实时不滞后】Used to identify "Order Blocks" (OB), based on Break of Structure (BOS) and Retest mechanisms. It detects candles in the opposite direction after swing highs/lows to form potential supply/demand zones, confirming and plotting valid OBs only upon price retest. The indicator emphasizes "real" OBs: requiring a strong impulse (> ATR * multiplier) and retest verification.
- **Core Functions**: Detect BOS (Break of Structure); find opposite candles after prior impulses; verify strength and retest; draw OB boxes and labels.
- **Applicable Scenarios**: Suitable for ICT strategies, supply-demand trading, or reversal identification. Helps filter false breakouts and shows only high-probability zones.
- **Display Mode**: Overlaid on the main chart, displaying OBs as boxes, supporting up to 500 boxes.
- **Limitations**: Retest period fixed at 15 bars; based on simple candlesticks (no volume filter); no automatic cleanup of old OBs (manual management required).
The indicator has no built-in alerts but can be extended. ATR is used dynamically to validate strength.
## Input Parameters
Input parameters are concise, divided into core settings and display group. Below explains each parameter’s default value, type, and function.
### Core Settings
- **Structure Lookback** (int, default: 10, min: 3): Lookback period for structure detection (length for ta.highest/lowest). Higher values detect stronger structures.
- **Minimum Impulse Strength (ATR ×)** (float, default: 1.5, min: 0.5): Minimum impulse strength ((high-low) > ATR * this value). Ensures significant movement before OB.
- **Bars to watch for Retest** (int, default: 15, min: 1): Number of bars to monitor for retest. OB is confirmed only if price retests the OB zone within N bars after a breakout.
### Display Settings
- **Show Bullish OBs** (bool, default: true): Show bullish OBs (demand zone, rebounds after retest).
- **Show Bearish OBs** (bool, default: true): Show bearish OBs (supply zone, reverses after retest).
Colors are fixed: green (bullish, 80% transparency), red (bearish, 80% transparency).
## Calculations and Display
### Break of Structure (BOS) Detection
- **ATR Calculation**: ta.atr(14) used for strength verification.
- **Swing High/Low**: ta.highest(high, lookback) / ta.lowest(low, lookback) to identify structure. ...
## Calculation and Display
### Structure Breakout (BOS) Detection
- **ATR Calculation**: `ta.atr(14)` used for strength verification.
- **Swing High/Low**: `ta.highest(high, lookback)` / `ta.lowest(low, lookback)` identify structure.
- **BOS Trigger**:
- **bullBOS**: close > hh (breaks previous high).
- **bearBOS**: close < ll (breaks previous low).
### Order Block Identification
- **getLastOppositeCandle(isBullish)**:
- Search for the most recent "opposite" candle within the lookback period (bullBOS: bearish candle close < open; bearBOS: bullish candle close > open).
- Returns the index (idx); if none, then na.
- **OB Logic** (only when showBullish/Bearish=true):
- **Bullish OB (bullBOS)**:
- Find previous bearish candle (idx), check momentum: (high-low) > ATR * atrMult.
- Calculate obLow = low , obHigh = high .
- Backtest check: within 15 candles low inside → inRetest = true.
- If confirmed: draw green box (from bar_index - idx to current, obLow to obHigh); label "🟩 Bullish OB (Valid)" (top-left, green, 80% transparency, white text).
- Push into bullOBs array.
- **Bearish OB (bearBOS)**: symmetric, red box, label "🟥 Bearish OB (Valid)" (bottom-left).
- **Array Management**: var box bullOBs/bearOBs store all OBs; no automatic cleanup (expandable).
### Display Elements
- **Boxes**: dynamically from idx to current candle, visually showing OB area.
- **Labels**: displayed when confirmed, positioned based on obHigh/obLow.
- No lines/fills; pure boxes + labels.
## Alert Functionality
The indicator has no built-in alerts but can be extended via TradingView alerts, for example:
- **New OB**: bullBOS and inRetest or bearBOS and inRetest.
- **Backtest**: price enters OB range.
It is recommended to add `alertcondition()` for custom alerts. ...
It is recommended to add a custom alertcondition(), such as 'Bullish OB Confirmed'.
## Usage Tips
- **Optimization**: lookback=10 balances sensitivity; atrMult=1.5 filters weak impulses; retestBars=15 is suitable for intraday.
- **Customization**: turn off showBullish/Bearish to hide types; add volume filtering to the fork for better accuracy.
- **Explanation**:
- **BOS + Backtesting**: ensure OB is 'real' (not a false breakout); only draw after backtesting to avoid noise.
- **Strength**: (high-low)>ATR*1.5 indicates strong impulses, making OB more reliable.
- **Application**: Bullish OB = buy zone (support); Bearish OB = sell zone (resistance).
- **Limitations**: fixed backtesting period may miss late retracements; no volume/time filtering; few OBs in low-volatility markets.
- **Extensions**: add OB counts or Fibonacci extensions.
ICT订单块交易指标,用于识别“订单块”(Order Blocks, OB),基于结构突破(Break of Structure, BOS)与回测(Retest)机制。它通过检测摆动高/低点后的相反方向烛台,形成潜在供给/需求区域,仅在价格回测时确认并绘制有效OB。指标强调“真实”OB:需强冲动(> ATR * 乘数)与回测验证。
- **核心功能**:检测BOS(结构突破);查找前冲动相反烛台;验证强度与回测;绘制OB盒子与标签。
- **适用场景**:适合ICT策略、供给需求交易或反转识别。帮助过滤假突破,仅显示高概率区域。
- **显示模式**:叠加在主图上,使用盒子(boxes)显示OB,支持最大500个盒子。
- **限制**:回测期固定15柱;基于简单烛台(无成交量过滤);无自动清理旧OB(手动管理)。
指标无内置警报,但可扩展。数据使用ATR动态验证强度。
## 输入参数
输入参数简洁,分为核心设置与显示组。以下说明每个参数的默认值、类型和作用。
### 核心设置
- **Structure Lookback** (int, 默认: 10, 最小: 3):结构检测回溯期(ta.highest/lowest的长度)。较高值检测更强结构。
- **Minimum Impulse Strength (ATR ×)** (float, 默认: 1.5, 最小: 0.5):最小冲动强度((high-low) > ATR * 此值)。确保OB前有显著移动。
- **Bars to watch for Retest** (int, 默认: 15, 最小: 1):回测监控柱数。突破后N柱内价格回测OB区域才确认。
### 显示设置
- **Show Bullish OBs** (bool, 默认: true):显示看涨OB(需求区,回测后反弹)。
- **Show Bearish OBs** (bool, 默认: true):显示看跌OB(供给区,回测后反转)。
颜色固定:绿(看涨,80%透明)、红(看跌,80%透明)。
## 计算与显示
### 结构突破(BOS)检测
- **ATR计算**:ta.atr(14) 用于强度验证。
- **摆动高/低**:ta.highest(high, lookback) / ta.lowest(low, lookback) 识别结构。
- **BOS触发**:
- **bullBOS**:close > hh (上破前高)。
- **bearBOS**:close < ll (下破前低)。
### 订单块识别
- **getLastOppositeCandle(isBullish)**:
- 查找最近lookback柱内“相反”烛台(bullBOS: 熊烛 close < open;bearBOS: 牛烛 close > open)。
- 返回索引(idx);若无则na。
- **OB逻辑**(仅当showBullish/Bearish=true):
- **看涨OB (bullBOS)**:
- 查找前熊烛(idx),检查冲动:(high-low) > ATR * atrMult。
- 计算obLow=low ,obHigh=high 。
- 回测检查:15柱内low 在 内 → inRetest=true。
- 若确认:绘制绿盒(bar_index-idx 到当前,obLow到obHigh);标签“🟩 Bullish OB (Valid)”(左上,绿,80%透明,白文本)。
- 推入bullOBs数组。
- **看跌OB (bearBOS)**:对称,红盒,标签“🟥 Bearish OB (Valid)”(左下)。
- **数组管理**:var box bullOBs/bearOBs 存储所有OB;无自动清理(可扩展)。
### 显示元素
- **盒子**:动态从idx到当前柱,延伸显示OB区域。
- **标签**:确认时显示,位置基于obHigh/obLow。
- 无线条/填充;纯盒子+标签。
## 警报功能
指标无内置警报,但可通过TradingView警报扩展,例如:
- **新OB**:bullBOS and inRetest 或 bearBOS and inRetest。
- **回测**:价格进入OB范围。
建议添加alertcondition()自定义,如“Bullish OB Confirmed”。
## 使用提示
- **优化**:lookback=10平衡敏感;atrMult=1.5过滤弱冲动;retestBars=15适合日内。
- **自定义**:关闭showBullish/Bearish隐藏类型;fork添加成交量过滤提升准确。
- **解释**:
- **BOS+回测**:确保OB“真实”(非假突破);仅回测后绘制,避免噪音。
- **强度**:(high-low)>ATR*1.5表示强冲动,OB更可靠。
- **应用**:看涨OB=买入区(支撑);看跌OB=卖出区(阻力)。
- **局限**:回测期固定,可能错过晚回测;无成交量/时间过滤;低波动市场少OB。
- **扩展**:添加OB计数或斐波那契扩展。

Confluence Engine [BullByte]CONFLUENCE ENGINE
Multi-Factor Technical Analysis Framework
OVERVIEW
Confluence Engine is a multi-dimensional technical analysis framework that evaluates market conditions across five distinct analytical pillars simultaneously. Rather than relying on a single indicator or signal source, this tool synthesizes Structure, Momentum, Volume, Volatility, and Pattern analysis into a unified scoring system that identifies high-probability trading opportunities when multiple technical factors align.
The core philosophy behind this indicator stems from a fundamental observation: isolated signals frequently fail, but when multiple independent analytical methods agree, the probability of a successful trade increases substantially. This indicator was developed after extensive research into why traders often receive conflicting signals from different indicators on their charts, leading to analysis paralysis and poor decision-making.
THE PROBLEM AND SOLUTION
The Problem:
Most traders use multiple indicators independently, often receiving contradictory signals. One indicator says "buy" while another says "wait." This creates confusion and leads to missed opportunities, premature entries based on incomplete analysis, difficulty quantifying how strong a setup actually is, and inconsistent decision-making across different market conditions.
The Solution:
Confluence Engine addresses this by providing a single, unified score (0-100) that represents the aggregate strength of a trading setup. Instead of mentally weighing five different indicators, traders receive a clear numerical score indicating setup quality, visual tier classification (ULTRA, HIGH, STANDARD), specific identification of which factors are strong or weak, and actionable guidance on what to watch for next.
THE FIVE ANALYTICAL DIMENSIONS
Each dimension was selected because it measures a fundamentally different aspect of market behavior:
STRUCTURE ANALYSIS
Evaluates price position relative to key levels and recent swing points. Markets respect structure - previous highs, lows, and areas where price reversed. This dimension identifies when price interacts with these critical levels and measures the quality of that interaction.
What it detects: Price approaching or sweeping swing highs/lows, reclaim patterns after false breakouts, EMA alignment and trend structure, exhaustion after extended moves.
MOMENTUM ANALYSIS
Measures the underlying strength and direction of price movement. Strong moves are characterized by momentum preceding price. This dimension evaluates whether momentum supports the current price direction.
What it detects: Oversold/overbought conditions with reversal potential, momentum divergence states, directional movement strength (ADX-based), momentum shifts before price confirmation.
VOLUME ANALYSIS
Volume validates price movement. Significant moves require participation. This dimension measures current volume relative to recent averages to determine if market participants are genuinely committing to the move.
What it detects: Volume spikes confirming price action, below-average volume warning of weak moves, climactic volume at potential reversals, volume confirmation of rejection patterns.
VOLATILITY ANALYSIS
Markets alternate between compression (low volatility) and expansion (high volatility). This dimension identifies these phases and recognizes when compression is likely to resolve into directional movement.
What it detects: Volatility squeeze conditions (Bollinger inside Keltner), squeeze release direction, ATR expansion indicating breakout potential, compression duration for timing breakouts.
PATTERN ANALYSIS
Candlestick patterns reflect the battle between buyers and sellers within each bar. This dimension evaluates the quality and context of reversal and continuation patterns.
What it detects: Engulfing patterns with quality scoring, hammer and shooting star formations, rejection wicks indicating trapped traders, pattern confluence with other factors.
WHAT MAKES THIS INDICATOR ORIGINAL Not a mashup
This is NOT a mashup of indicators displayed together. The Confluence Engine represents an integrated analytical framework with the following unique characteristics:
Unified Scoring System: All five dimensions feed into a proprietary scoring algorithm that weights and combines their signals. The output is a single 0-100 score, not five separate readings.
Multi-Factor Gate: Beyond just scoring, the system requires a minimum number of factors to be "active" (meeting their individual thresholds) before allowing signals. This prevents signals based on one extremely strong factor masking four weak ones.
Regime-Aware Adjustments: The engine detects the current market regime (trending, ranging, volatile, weak) and automatically adjusts factor weights and score multipliers. A structure signal means something different in a trending market versus a ranging market.
Adaptive Risk Management: Take-profit and stop-loss levels are not static. They adapt based on current volatility, market regime, and signal quality - providing tighter targets in low-volatility environments and wider targets when volatility expands.
Liquidity Sweep Detection: A distinctive feature that identifies when price has swept beyond a swing high/low and then reclaimed back inside. This pattern often indicates stop hunts followed by reversals.
Signal Quality Tiers: Rather than just "signal" or "no signal," the engine classifies setups into tiers. ULTRA (80+) represents highest probability setups with all factors aligned. HIGH (70-79) represents strong setups with multiple factors confirming. STANDARD meets minimum threshold for acceptable setups.
HOW THE SCORING WORKS
Each of the five factors generates a raw score from 0-100 based on current market conditions. These raw scores are then weighted according to the selected trading style (Balanced, Scalper, Swing, Range, Trend), adjusted based on current market regime detection, modified by higher timeframe alignment (if enabled), bonused when multiple factors exceed their activation thresholds simultaneously, and multiplied by session factors (if session filter is enabled).
The result is a final Bull Score and Bear Score, each ranging from 0-100, representing the current strength of long and short setups respectively.
Signal Generation Requirements:
- Score meets minimum threshold (configurable: 60-95)
- Required number of factors are "active" (default: 3 of 5)
- Market regime is not blocked (if blocking enabled)
- Higher timeframe alignment passes (if required)
- Cooldown period from last signal has elapsed
UNDERSTANDING THE DASHBOARDS
Main Dashboard (Top Right)
The main dashboard displays real-time scores and market context:
LONG Score - Current bullish setup strength (0-100) with quality tier displayed
SHORT Score - Current bearish setup strength (0-100) with quality tier displayed
Regime - Current market state showing TREND UP, TREND DN, VOLATILE, RANGE, or WEAK
HTF - Higher timeframe alignment showing BULL, BEAR, NEUT, or OFF
Squeeze - Volatility state showing SQZ (in squeeze), REL+ (bullish release), REL- (bearish release), or NORM
Gate - Factor count versus requirement, for example 4/3 means 4 factors active with 3 required
Sweep L/S - Liquidity sweep status for long and short setups
ATR% - Current ATR as percentile of recent range indicating relative volatility
Vol - Current volume relative to 20-period average
R:R - Current risk-reward ratio based on adaptive TP/SL calculations
Trade - Active trade status and unrealized profit/loss percentage
Analysis Dashboard (Bottom Left)
The analysis dashboard provides actionable guidance:
Signal Readiness - Visual progress bars showing how close each direction is to generating a signal
Blocking Factors - Identifies which specific factor is weakest and preventing signals
Recommended Action - Context-aware guidance such as WATCH, WAIT, MANAGE, or SCAN
Watch For - Specific events to monitor for setup completion
Opportunity Level - Overall market opportunity rating from EXCELLENT to VERY POOR
Timing - Contextual timing guidance based on current conditions
Status Bar (Bottom Center)
Compact view displaying Long Score, Gate Status, Current State, Gate Status, and Short Score in a single row for quick reference.
Dashboard Size - Auto Mode Explained
When Dashboard Size is set to "Auto", the indicator intelligently adjusts text size based on your current chart timeframe to optimize readability:
Auto-Sizing Logic:
1-Minute to 5-Minute Charts → Tiny
- Lower timeframes show more bars on screen
- Tiny text prevents dashboard from obscuring price action
- Recommended for scalping and high-frequency monitoring
15-Minute Charts → Small
- Balanced size for intraday trading
- Readable without being intrusive
1-Hour to Daily Charts → Normal
- Standard size for most trading styles
- Optimal readability for swing trading
Weekly and Monthly Charts → Large
- Larger text for position trading
- Fewer bars visible so space is available
Manual Override:
You can override auto-sizing for any dashboard individually:
- Dashboard Size (All): Sets master size applied to all dashboards
- Main Dashboard Size: Override for top-right dashboard specifically
- Analysis Panel Size: Override for bottom-left panel specifically
- Status Bar Size: Override for bottom-center bar specifically
Example Use Case:
Trading on 5m chart (default = Tiny) but you have good eyesight and large monitor:
- Set "Dashboard Size (All)" to "Small" or "Normal" for better readability
- Individual dashboards will use your override instead of auto-sizing
Recommendation:
Start with Auto mode and only adjust if dashboards are too large or too small for your monitor/eyesight.
UNDERSTANDING SIGNAL LABELS
When a signal generates, a label appears with trade information:
Minimal Style Example:
LONG 85
Shows tier icon, direction, and score only.
Detailed Style Example:
ULTRA LONG
Score: 85
Entry: 50250.50
TP1: 50650.25
TP2: 51500.75
SL: 49850.25
R:R 1:2.5
Regime: TREND UP
HTF: BULL
Tier Icons Explained:
indicates ULTRA quality with score 80 or higher
indicates HIGH quality with score between 70 and 79
indicates STANDARD quality with score meeting minimum threshold
UNDERSTANDING TRADE ZONES
When a signal generates, visual elements appear on the chart:
Entry Line (Purple) marks the entry price level
TP1 Line (Blue Dashed) marks the first take-profit target
TP2 Line (Cyan Dashed) marks the final take-profit target
SL Line (Orange Dotted) marks the stop-loss level
Trade Zone Box shows shaded area from SL to TP2
These elements extend forward as price progresses. When TP1 is hit, its line becomes solid to indicate achievement. When the trade completes at either TP2 or SL, all elements are cleaned up and the entry label converts to a compact ghost label for historical reference.
Exit Labels Explained:
+X.XX% indicates first target reached with partial profit secured
+X.XX% indicates full target reached with maximum profit achieved
-X.XX% indicates stop-loss triggered
TP1 Hit, SL... indicates stopped out after TP1 was already hit (optional display)
OPPOSITE SIGNAL HANDLING
When market conditions shift dramatically, the engine may generate a signal in the opposite direction while an existing trade is active. This represents a significant change in confluence and is handled automatically:
Automatic Trade Reversal Process:
1. Detection: New signal triggers opposite to current trade direction (e.g., SHORT signal while LONG trade is active)
2. Current Trade Closure:
- All visual elements (entry line, TP/SL lines, trade zone) are deleted
- Current trade is marked as closed
3. Entry Label Conversion:
- The detailed entry label is converted to a compact ghost label
- Ghost label shows direction + score (e.g., "LONG 75")
- Marked with "OPP" outcome to indicate opposite signal closure
- Moved to a non-interfering position below/above price
4. New Trade Initialization:
- Fresh entry label created for new direction
- New TP1, TP2, SL levels calculated based on new signal quality
- Trade zone and price lines drawn for new trade
Example Scenario:
You enter a LONG trade at score 72. Price moves sideways for 8 bars, then market structure breaks down. Confluence shifts heavily bearish with a sweep reclaim bear + momentum + volume spike, generating a SHORT signal at score 81. The engine automatically:
- Closes the LONG trade
- Converts "LONG 72" entry label to a small ghost label
- Opens new SHORT trade at current price
- Displays new SHORT entry label with full trade details
Trading Implication:
This behavior ensures the engine is always aligned with the highest-probability direction based on current confluence. It prevents you from holding a position when all five factors have flipped against you.
Note: This does NOT happen for every small score change. The opposite signal must meet all signal generation requirements (minimum score, gate pass, regime check, HTF alignment) before triggering. Typically occurs during strong trend reversals or major support/resistance breaks.
EXAMPLE TRADE : LONG
Instrument and Exchange: Bitcoin / TetherUS (BTC/USDT) on Binance
Timeframe: 5-minute
Timestamp: Nov 27, 2025 12:39 UTC
Indicator Script: Confluence Engine v1.0
Trade Type: Long (Example Trade)
Setting Used: Default
Signal Details:
- Tier: HIGH
- Score: 70
- Entry Price: 90040.70
- TP1 Target: 90868.63
- TP2 Target: 92110.52
- Stop Loss: 89325.94
- Risk Reward: 1:2.9
Trade Outcome:
- TP1 hit after 12 bars (+0.95%)
- TP2 hit after 28 bars (+2.85%)
- Total gain: +2.85% on full position
EXAMPLE TRADE : SHORT with Dashboard Explanation and interpretation
Instrument and Exchange: Ethereum / U.S. Dollar (ETH/USD) — Coinbase
Timeframe: 1-hour
Timestamp (screenshot): Nov 28, 2025 16:41 UTC
Indicator Script: Confluence Engine v1.0
Trade Type: Short (Example Trade)
Setting Used: Default
Signal Details
-Tier: STANDARD (STD)
-Score: 64
-Entry Price: 3037.26
-TP1 Target: 2981.61 (-55.65 pts)
-TP2 Target: 2898.12 (-139.14 pts)
-Stop Loss: 3099.79 (+62.53 pts)
-Risk:Reward: ≈ 1 : 2.2 (TP2/SL)
-Market Context at Signal
-Regime: TREND UP (contextual regime at time of signal) — mixed environment for shorts
-HTF Alignment: OFF (no higher-timeframe confirmation)
-Gate Status: 3 / 3 (minimum factor groups active — gate passed)
-Squeeze Status: NORM (no active compression breakout)
-Volume: ~1.8× average (elevated participation)
-ATR%: 57% (elevated volatility)
Analysis Dashboard Reading (what the user sees)
-Long Readiness: Needs +36 points to qualify.
-Short Readiness: Needs +11 points to qualify (closer but not auto-entering).
-Blocking Factors: Structure = 0 — the single decisive blocker preventing fresh signals.
-Opportunity Level: VERY POOR (roughly 20 / 100) — low quality environment for adding positions.
-Timing: Wait for better setup (do not add new positions).
-Trade Outcome (screenshot moment)
-Trade state: Active SHORT (opened earlier).
-Live P&L (snapshot): +0.14% (managing trade).
-TP1/TP2: Targets shown on chart (TP1 2981.61, TP2 2898.12). Not closed yet at screenshot.
-Visuals: Entry label, TP/SL lines and trade zone are displayed and being extended while trade is active.
Interpretation
The engine produced a standard short (Score 64) while the market showed elevated volume and volatility but no HTF confirmation. Although the Gate passed (3/3), Structure = 0 blocks the indicator from issuing fresh entries — this is intentional and by design: one missing factor (structure) is enough to prevent new signals even when other factors look supportive. The currently open short is being managed (partial targets and SL visible), but the system's recommendation is to manage the existing trade only and not open new shorts until structure or HTF alignment improves.
Why this example matters (teaching point)
-Gate ≠ Go: Gate pass (factor count) alone does not force fresh trades — the system enforces additional checks (structure, regime, HTF) to avoid lower-quality setups.
-Volume & Volatility are necessary but not sufficient: High volume and wide ATR create movement but do not replace structural validation.
-Active trade vs new entries: The script will continue to manage an already open trade but will not create a new signal while a blocking factor remains. This prevents overtrading and reduces false positives.
-Practical trader actions shown by the example
-Manage existing SHORT only: Trail to breakeven if TP1 is taken; scale out at TP1; hold remaining if price respects trend and structure reclaims.
-Do not add fresh positions: Wait for Structure > 0 or a HTF alignment that lifts the block.
-Watch for signals that matter: Sweep reclaim, HTF alignment turning bullish for shorts (i.e., HTF changes to BEAR), or a squeeze release with volume spike — these can clear the blocker and validate new entries.
RECOMMENDED TIMEFRAMES
For Scalping on 1m, 5m, or 15m charts: Use higher factor thresholds and shorter cooldowns. The faster pace requires stricter filtering.
For Day Trading on 15m, 30m, or 1H charts: This provides a balance of signal frequency and reliability suitable for most active traders.
For Swing Trading on 1H, 4H, or Daily charts: Expect higher quality signals with longer hold periods and fewer false signals.
For Position Trading on Daily or Weekly charts: Focus on ULTRA signals only for maximum conviction on longer-term positions.
Higher Timeframe Alignment Recommendations:
When trading 5m, use 1H as your HTF
When trading 15m, use 1H or 4H as your HTF
When trading 1H, use 4H or Daily as your HTF
When trading 4H, use Daily as your HTF
The general rule is to select an HTF that is 4 to 12 times your trading timeframe.
TRADING STYLE PRESETS
Balanced (Default)
Equal weighting across all five factors at 20% each. Suitable for most market conditions and recommended as starting point.
Scalper
Emphasizes Volume at 30% and Volatility at 30%. Designed for quick in-and-out trades on lower timeframes where immediate momentum and volatility expansion matter most.
Swing Trader
Emphasizes Structure at 30% and Momentum at 30%. Focuses on catching larger moves where trend direction and key levels are paramount.
Range Trader
Emphasizes Structure at 35% and Pattern at 25%. Optimized for sideways markets where support/resistance levels and reversal patterns dominate.
Trend Follower
Emphasizes Momentum at 40%. Designed for trending markets where staying with the dominant direction is the priority.
QUALITY MODE SETTINGS
Custom Mode
Set your own minimum score threshold. Lower thresholds between 60 and 65 generate more signals but with lower average quality. Higher thresholds of 75 or above generate fewer but higher-quality signals.
High Quality Mode
Uses minimum score of 70. Recommended for most users as it filters out marginal setups while still providing reasonable signal frequency.
Ultra Only Mode
Uses minimum score of 80 for maximum selectivity. Only the highest-conviction setups generate signals. Recommended for swing and position traders or during uncertain market conditions.
REGIME DETECTION
The engine continuously evaluates market conditions and classifies them into five states:
TREND UP
Characteristics: Strong ADX reading with EMAs aligned in bullish order
Trading Implications: Long signals receive score boost while short signals are suppressed. Momentum factor gains additional weight.
TREND DN
Characteristics: Strong ADX reading with EMAs aligned in bearish order
Trading Implications: Short signals receive score boost while long signals are suppressed. Momentum factor gains additional weight.
VOLATILE
Characteristics: High ATR percentile, wide Bollinger Bands, elevated volume
Trading Implications: Both directions remain viable but wider stops are recommended. Volume factor gains additional weight.
RANGE
Characteristics: Low ADX reading, narrow Bollinger Bands, low ATR percentile
Trading Implications: Structure signals are emphasized while momentum signals are suppressed. Pattern recognition becomes more important.
WEAK
Characteristics: Unclear or mixed conditions that do not fit other categories
Trading Implications: Reduced confidence in all signals. Consider waiting for clearer market conditions.
Filter Mode Options:
Off - Regime is detected and displayed but no score adjustments are applied
Adjust Scores - Automatically modifies factor weights based on current regime
Block Weak Regimes - Prevents signals from generating when regime is RANGE or WEAK
VOLATILITY SQUEEZE DETECTION
A volatility squeeze occurs when Bollinger Bands contract inside the Keltner Channel, indicating reduced volatility and potential energy building for a breakout.
Squeeze States Explained:
SQZ with bar count (example: SQZ 15)
Indicates currently in squeeze for the displayed number of bars. A score penalty is applied during this phase because compression represents uncertainty about direction.
REL+ (Release Bullish)
Indicates squeeze has released with price above the basis line. Score bonus is applied for long setups as this often precedes strong upward moves.
REL- (Release Bearish)
Indicates squeeze has released with price below the basis line. Score bonus is applied for short setups as this often precedes strong downward moves.
NORM (Normal)
No active squeeze detected. Standard scoring applies.
Trading Implication:
Squeeze releases often produce strong directional moves. The engine detects both the squeeze duration and the release direction, awarding bonus points to signals that align with the release. Longer squeeze duration often corresponds to more powerful breakouts.
LIQUIDITY SWEEP DETECTION
Markets often sweep beyond obvious support and resistance levels to trigger stops before reversing. The engine detects these patterns:
Bullish Sweep Reclaim
Price sweeps below recent swing low, triggering stop losses, then reclaims back above the swing low. This often indicates smart money accumulation after retail stops are collected.
Bearish Sweep Reclaim
Price sweeps above recent swing high, triggering stop losses, then reclaims back below the swing high. This often indicates smart money distribution after retail stops are collected.
Sweep Status in Dashboard:
RCL (Reclaim) - Reclaim has been confirmed. This receives highest structure score as the pattern is complete.
PND (Pending) - Sweep has occurred and price is near the level but full reclaim not yet confirmed. Watching for completion.
ACT (Active) - Sweep is currently in progress with price beyond the swing level.
Dash (-) - No sweep activity detected.
MULTI-FACTOR GATE SYSTEM
Beyond overall score, the engine counts how many individual factors meet their activation threshold.
Example Calculation:
Structure score 45 with threshold 35 equals ACTIVE
Momentum score 25 with threshold 30 equals INACTIVE
Volume score 50 with threshold 35 equals ACTIVE
Volatility score 40 with threshold 30 equals ACTIVE
Pattern score 35 with threshold 30 equals ACTIVE
Result: 4 of 5 factors are active
If minimum required factors is set to 3, this example passes the gate and receives a 4-factor bonus.
Gate Bonuses:
4 factors active adds 8 points to final score (default setting)
5 factors active adds 15 points to final score (perfect confluence)
Purpose:
This mechanism prevents scenarios where one extremely high factor score masks four weak factors. A score of 75 with only 2 active factors is less reliable than a score of 70 with 4 active factors.
ADAPTIVE RISK MANAGEMENT
Take-profit and stop-loss distances adjust dynamically based on three inputs:
Volatility Influence (default 40% weight)
Low ATR percentile produces tighter targets
High ATR percentile produces wider targets
This ensures stops are not too tight in volatile conditions or too wide in calm conditions.
Regime Influence (default 30% weight)
Trending market with aligned signal produces extended targets
Ranging market produces contracted targets
Volatile regime produces wider stops for protection
Score Influence (default 30% weight)
ULTRA signals (high conviction) receive extended targets
STANDARD signals receive standard targets
Higher conviction justifies larger profit expectations.
You can configure the weight of each influence in settings to match your trading style.
SESSION FILTER (Optional Feature)
When enabled, the engine applies score multipliers based on the trading session:
Asian Session (default 0.9x multiplier)
Characterized by lower volatility and ranging tendency. Score reduction reflects reduced opportunity.
London Session (default 1.1x multiplier)
Characterized by high volatility and trend initiation. Score boost reflects increased opportunity.
London/NY Overlap (default 1.2x multiplier)
Characterized by highest liquidity and strongest moves. Maximum score boost reflects peak trading conditions.
New York Session (default 1.05x multiplier)
Characterized by volatility but typically after initial moves have occurred.
Configure your UTC offset in settings to align session detection with your chart timezone.
ALERT SYSTEM
The indicator provides comprehensive alerts with dynamic data:
Signal Alerts:
- ULTRA Long Signal with full trade details
- ULTRA Short Signal with full trade details
- HIGH Long Signal with key levels
- HIGH Short Signal with key levels
- Any Long Signal with basic info
- Any Short Signal with basic info
Trade Management Alerts:
- TP1 Reached with profit percentage
- TP2 Full Target with total profit
- Stop Loss Hit with loss percentage and status
Technical Event Alerts:
- Squeeze Release
- Liquidity Sweep
- Perfect Confluence
- Regime Change
All alerts include actual calculated values such as score, entry price, target levels, stop level, and risk-reward ratio at the time of trigger.
AUTOMATIC SETTINGS VALIDATION
The indicator performs comprehensive validation when first loaded on a chart. If configuration errors are detected, a warning label appears on the chart with specific guidance.
Critical Errors (Prevent Signal Generation):
ULTRA threshold must exceed HIGH threshold
- Example error: HIGH = 75, ULTRA = 70
- Fix: Ensure ULTRA threshold is higher than HIGH threshold
- Default safe values: HIGH = 70, ULTRA = 80
Minimum factors cannot exceed 5
- The gate requires 3 to 5 factors (you cannot require 6 of 5 factors)
- Fix: Set minimum active factors to 3, 4, or 5
TP2 multiplier must exceed TP1 multiplier
- Example error: TP1 = 3.0 ATR, TP2 = 2.0 ATR
- Fix: Ensure TP2 (final target) is farther than TP1 (partial target)
- Default safe values: TP1 = 2.0, TP2 = 5.0
Swing lookback minimum is 3 bars
- Liquidity sweep detection requires at least 3 bars to identify swing highs/lows
- Fix: Increase swing lookback period to 3 or higher
ATR period minimum is 5 bars
- ATR calculation requires sufficient data for accuracy
- Fix: Increase ATR period to 5 or higher (14 recommended)
Higher timeframe must be larger than chart timeframe
- Example error: Trading on 1H chart with MTF set to 15m
- Fix: Select HTF that is 4-12x your chart timeframe
- Example: If trading 15m, use 1H or 4H as HTF
Warnings (Signal Generation Continues):
Score threshold below 50 generates many signals
- Lower thresholds increase signal frequency but reduce quality
- Recommendation: Use minimum 60 for active trading, 70+ for swing trading
Cooldown below 3 bars may cause signal clustering
- Very short cooldowns can produce multiple signals in quick succession
- Recommendation: Use 5+ bars for lower timeframes, 3+ for higher timeframes
Validation Label Display:
When errors are detected, a label appears at the top of the chart showing:
SETTINGS QUICK REFERENCE
Signal Quality Section:
Quality Mode: High Quality recommended for most users
Custom Minimum Score: Used when Quality Mode is set to Custom (range 30-95)
HIGH Threshold: Score required for HIGH tier classification (default 70)
ULTRA Threshold: Score required for ULTRA tier classification (default 80)
Regime Engine Section:
Enable Regime Detection: Activates automatic market state classification
Filter Mode: Off, Adjust Scores, or Block Weak Regimes
ADX Strong Threshold: ADX level indicating strong trend (default 25)
ADX Weak Threshold: ADX level indicating ranging conditions (default 15)
Show Regime Background: Displays subtle background color for current regime
Liquidity and Squeeze Section:
Enable Liquidity Sweep Detection: Activates sweep and reclaim pattern detection
Swing Lookback Period: Bars used to identify swing highs and lows (default 8)
Reclaim Threshold: Percentage of range price must reclaim after sweep (default 15%)
Enable Volatility Squeeze Detection: Activates Bollinger/Keltner squeeze detection
Keltner Channel Multiplier: Width multiplier for Keltner Channel (default 1.5)
Squeeze Penalty: Points subtracted during active squeeze (default 25)
Squeeze Release Bonus: Points added on squeeze release (default 20)
Enable Multi-Factor Gate: Requires minimum factors active before signaling
Minimum Active Factors: How many factors must meet threshold (default 3)
Individual Factor Thresholds: Customize activation threshold for each factor
4-Factor Bonus: Points added when 4 of 5 factors active (default 8)
5-Factor Bonus: Points added when all 5 factors active (default 15)
MTF Confluence Section:
Enable MTF Confluence: Activates higher timeframe trend analysis
Higher Timeframe: Select timeframe for trend alignment (recommend 4-12x chart TF)
Require HTF Alignment: Block signals opposing higher timeframe trend
Show HTF EMAs: Display higher timeframe EMA 21 and EMA 50 on chart
Trading Style Section:
Enable Style Weighting: Activates factor weight adjustments based on style
Trading Style: Balanced, Scalper, Swing Trader, Range Trader, or Trend Follower
Custom Weights: Individual weight sliders when fine-tuning is needed
Session Filter Section:
Enable Session Filter: Activates session-based score multipliers
Your UTC Offset: Your timezone offset for accurate session detection
Session Multipliers: Individual multipliers for Asian, London, New York, and Overlap sessions
Risk Parameters Section:
ATR Period: Period for Average True Range calculation (default 14)
TP1 ATR Multiple: First target distance as ATR multiple (default 2.0)
TP2 ATR Multiple: Final target distance as ATR multiple (default 5.0)
SL ATR Multiple: Stop loss distance as ATR multiple (default 2.0)
Enable Adaptive TP/SL: Activates dynamic adjustment based on conditions
Volatility Weight: Influence of ATR percentile on adaptive calculation (default 40%)
Regime Weight: Influence of market regime on adaptive calculation (default 30%)
Score Weight: Influence of signal score on adaptive calculation (default 30%)
Appearance Section:
Color Theme: Matrix (green/red), Dark (modern dark), or Light (clean light)
Label Detail: Minimal (score only), Standard (key info), or Detailed (full breakdown)
Dashboard Size Controls: Master size and individual overrides for each dashboard
Show Trade Zones: Display shaded box from SL to TP2 for active trades
Show TP/SL Labels: Display price labels on target and stop lines
Show Trailing Exit Labels: Display exit label when stopped after TP1 hit
Show Main Dashboard: Toggle main dashboard visibility (top right)
Show Analysis Dashboard: Toggle analysis panel visibility (bottom left)
Show Status Bar: Toggle compact status bar visibility (bottom center)
Performance Section:
Performance Mode: Reduces visual elements on lower timeframes automatically
Max Ghost Labels: Maximum historical signal labels to retain (default 50)
Signal Cooldown: Minimum bars between signals in same direction (default 5)
Enable Script Alerts: Controls whether alert() calls fire automatically (default ON)
- ON: Dynamic alerts with calculated values fire automatically
- OFF: alert() suppressed, alertcondition() still available for manual creation
- Use OFF when testing settings or monitoring multiple instruments visually
- Toggle per-chart for selective alert coverage across watchlist
Show Factor Markers: Display shapes on chart when 3, 4, or 5 factors align
Show Score Breakdown: Display detailed factor scores table in debug panel
Show Regime Debug: Display regime state and ADX value in debug panel
Show MTF Debug: Display higher timeframe status in debug panel
DEBUG MODE AND FACTOR MARKERS
The indicator includes optional debug tools for traders who want deeper insight into the scoring mechanics and factor analysis. These features are disabled by default to keep the chart clean but can be enabled in the Debug Mode settings group.
FACTOR MARKERS
When "Show Factor Markers" is enabled, visual shapes appear on the chart indicating confluence states:
Perfect Confluence (5/5 Factors Active)
A circle appears below the bar for bullish or above the bar for bearish setups. This represents maximum confluence where all five analytical dimensions meet their activation thresholds simultaneously. A small label showing "5/5" also appears. This is a rare occurrence and typically precedes the highest quality signals. Background color shifts to highlight this exceptional alignment.
Strong Confluence (4/5 Factors Active)
A diamond shape appears below the bar for bullish or above the bar for bearish setups. This represents strong confluence with four of five factors active. A label showing "4/5" appears when this state is first achieved. This level of confluence is associated with high-quality setups.
Ready Confluence (3/5 Factors Active)
A triangle appears below the bar (pointing up) for bullish or above the bar (pointing down) for bearish setups. This represents the minimum confluence level required when gate is set to 3 factors. No label appears for this level to reduce visual clutter.
Confluence Background
When factor markers are enabled, a subtle background color appears indicating the current confluence state. Stronger colors indicate higher confluence levels. Bullish confluence shows green tints while bearish confluence shows red tints.
Purpose of Factor Markers:
These markers help traders visualize when confluence is building before a signal triggers. You might see a 4/5 diamond appear one or two bars before the actual signal, giving you advance notice that conditions are aligning. This can help with preparation and timing.
DEBUG PANEL (Bottom Right)
When any debug option is enabled, a debug panel appears in the bottom right corner of the chart providing detailed scoring information.
Score Breakdown Table
When "Show Score Breakdown" is enabled, the panel displays:
Factor column showing Structure, Momentum, Volume, Volatility, and Pattern
Bull column showing raw score (0-100) for each bullish factor
Bear column showing raw score (0-100) for each bearish factor
Weight column showing current percentage weight for each factor
Below the factor rows :
FINAL row shows the calculated final Bull and Bear scores after all adjustments
Adj row shows total adjustments applied including gate bonus, squeeze adjustment, and exhaustion adjustment with positive or negative sign
This breakdown allows you to see exactly which factors are contributing to the score and which are lagging. If you notice Structure consistently low, you know to wait for better price positioning relative to swing levels.
Regime Debug
When "Show Regime Debug" is enabled, the panel displays:
Current regime state (TREND UP, TREND DN, VOLATILE, RANGE, WEAK)
Current ADX value driving the regime classification
This helps you understand why certain score adjustments are being applied and verify the regime detection is working as expected for current market conditions.
MTF Debug
When "Show MTF Debug" is enabled, the panel displays:
Current MTF alignment status (BULL, BEAR, NEUT)
The higher timeframe being analyzed
This confirms the higher timeframe data is being read correctly and shows you the trend bias from the larger timeframe perspective.
Using Debug Mode Effectively
For Learning: Enable all debug options when first using the indicator to understand how scores are calculated and what drives signal generation.
For Optimization: Use score breakdown to identify which factors are consistently weak in your chosen market and timeframe. This can inform whether to adjust factor thresholds or switch trading styles.
For Troubleshooting: If signals seem inconsistent, enable debug to see exactly what values the engine is working with. This helps identify if a specific factor is behaving unexpectedly.
For Live Trading: Disable debug features to keep chart clean and reduce visual distraction. The main dashboards provide sufficient information for trade execution.
Debug Settings Summary:
Show Factor Markers - Displays shapes on chart when 3, 4, or 5 factors align. Useful for seeing confluence build before signals trigger.
Show Score Breakdown - Displays detailed table with all raw factor scores, weights, and adjustments. Useful for understanding exactly how final score is calculated.
Show Regime Debug - Adds regime state and ADX value to debug panel. Useful for verifying regime detection accuracy.
Show MTF Debug - Adds higher timeframe status and timeframe to debug panel. Useful for confirming MTF data is loading correctly.
PERFORMANCE CONSIDERATIONS
On lower timeframes such as 1-minute and 5-minute charts, the indicator creates visual elements including labels, lines, and boxes that may impact performance on slower devices.
Performance Mode automatically reduces visual elements, optimizes calculation frequency, and limits historical ghost labels when enabled.
Configure Max Ghost Labels (default 50) to control how many historical signal labels are retained on the chart.
NON-REPAINTING DESIGN
Signal Integrity:
All entry and exit signals generate only on confirmed (closed) bars using barstate.isconfirmed checks. This ensures signals do not appear and disappear during bar formation.
Higher Timeframe Data:
MTF analysis uses request.security with lookahead disabled (barmerge.lookahead_off) to prevent future data from influencing current calculations.
Visual Elements:
Lines, boxes, and labels for active trades update in real-time for monitoring purposes but this visual updating does not affect signal generation logic. Entry decisions are made solely on confirmed bar data.
DISCLAIMER
Trading financial instruments involves substantial risk of loss and is not suitable for all investors. Past performance does not guarantee future results. This indicator is a technical analysis tool provided for educational purposes only. It does not constitute financial advice, trading recommendations, or solicitation to buy or sell any financial instrument.
The developer makes no representations regarding the accuracy of signals or the profitability of trading based on this indicator. Users assume full responsibility for their trading decisions and should conduct their own analysis before entering any trade.
Always use proper risk management. Never risk more than you can afford to lose. Consider consulting a qualified financial advisor before making trading decisions.
VERSION HISTORY
v1.0 - Initial Release
- Five-factor confluence scoring system
- Regime detection and automatic adaptation
- Liquidity sweep and reclaim detection
- Volatility squeeze state machine
- Multi-factor gate with bonus system
- Adaptive risk management
- Comprehensive alert system
- Three dashboard display panels
- Session filter with multipliers
- Multiple trading style presets
- Theme customization options
Developed by BullByte
Pine Script v6
2025

The Strat - Levels [rdjxyz]◆ OVERVIEW
The Strat - Levels dynamically displays key levels used in The Strat trading methodology, developed by Rob Smith. The level colors are dynamically determined by their Strat classification (1, 2 up, failed 2 up, 2 down, failed 2 down, 3)—making it easy to recognize higher timeframe Strat candle classifications from any lower timeframe.
◆ DETAILS
If you're unfamiliar with The Strat, there are 3 universal scenarios regarding candle behavior:
SCENARIO ONE
The 1 Bar - Inside Bar: A candle that doesn't take out the highs or the lows of the previous candle; aka consolidation.
SCENARIO TWO
The 2 Bar - Directional Bar: A candle that takes out one side of the previous candle; aka trending (or at least attempting to trend).
These can be broken down even further as follows:
2 Up: A candle that takes out the high of the previous candle and closes bullish
Failed 2 Up: A candle that takes out the high of the previous candle and closes bearish
2 Down: A candle that takes out the low of the previous candle and closes bearish
Failed 2 Down: A candle that takes out the low of the previous candle and closes bullish
SCENARIO THREE
The 3 Bar - Outside Bar: A candle that takes out both sides of the previous candle; aka broadening formation.
◇ HOW THE DYNAMIC LEVEL COLORING WORKS
PREVIOUS LEVELS
Previous Day High/Low
Previous Week High/Low
Previous Month High/Low
Previous Quarter High/Low
Previous Year High/Low
Each period's levels are compared to their previous period's levels and colored according to the 3 universal scenarios, which are fixed based on historical data. (No repainting)
CURRENT LEVELS
Current Day Open
Current Week Open
Current Month Open
Current Quarter Open
Current Year Open
Each current period's levels (high, low, and current price) are compared to the previous period's levels and current period's open on every tick—changing colors in real-time as their Strat classification changes. (Will repaint as price action evolves)
E.g. When a new day opens inside of the previous day's range (high/low) the Day Open line will be gray (default for inside bars). When the current day trades above the previous day's range, the Day Open line will become aqua (default for 2 up). If price trades back below the current day's open, the Day Open line will become fuchsia (default for failed 2 up). And if price trades below the previous day's range, the Day Open line will become dark purple (default for 3s).
◆ SETTINGS
Current Day Open
Previous Day High/Low
Current Week Open
Previous Week High/Low
Current Month Open
Previous Month High/Low
Current Quarter Open
Previous Quarter High/Low
Current Year Open
Previous Year High/Low
Strat Colors
Each Current Level Open has 4 inputs:
Show/Hide Checkbox
Line Style
Line Width
Label Offset (Integer)
Each Previous Level High/Low has 5 inputs:
Show/Hide High Checkbox
Show/Hide Low Checkbox
Line Style
Line Width
Label Offset (Integer)
And each Strat scenario can be custom colored:
1-Bar Color - Default Gray
2-Up Color - Default Aqua
Failed 2-Up Color - Default Fuchsia
2-Down Color - Default White
Failed 2-Down Color - Default Teal
3-Bar Color - Default Dark Purple
◆ USAGE
There are 3 ways to look at these levels:
Potential continuation (e.g. Previous Day's 2-Up High being broken by Current Day's Price)
Potential reversal (e.g. Previous Day's 2-Down High being broken by Current Day's Price)
Potential exhaustion risk (e.g. Previous Month's Low is broken by Current Day's Price but trades back up into the Previous Month's range)
It's best to use this indicator with a separate indicator that color codes your chart's candles according to their Strat Scenario (1, 2, 3) and use top-down analysis to gauge whether to view levels as a sign of continuation, reversal, or exhaustion risk.
◆ WRAP UP
As demonstrated, The Strat - Levels offers Strat Scenario color-coded key levels, making it easy to identify the previous period's Strat Scenario (1, 2-Up, Failed 2-Up, 2-Down, Failed 2-Down, or 3) without needing to manually plot levels or refer to higher timeframes.
◆ DISCLAIMER
This indicator is a tool for visual analysis and is intended to assist traders who follow The Strat methodology. As with any trading methodology, there's no guarantee of profits; trading involves a high degree of risk and you could lose all of your invested capital. Use of this indicator is not indicative of future results and does not constitute and should not be construed as investment advice. All trading decisions and investments made by you are at your own discretion and risk. Under no circumstances shall the author be liable for any direct, indirect, or incidental damages. You should only risk capital you can afford to lose.
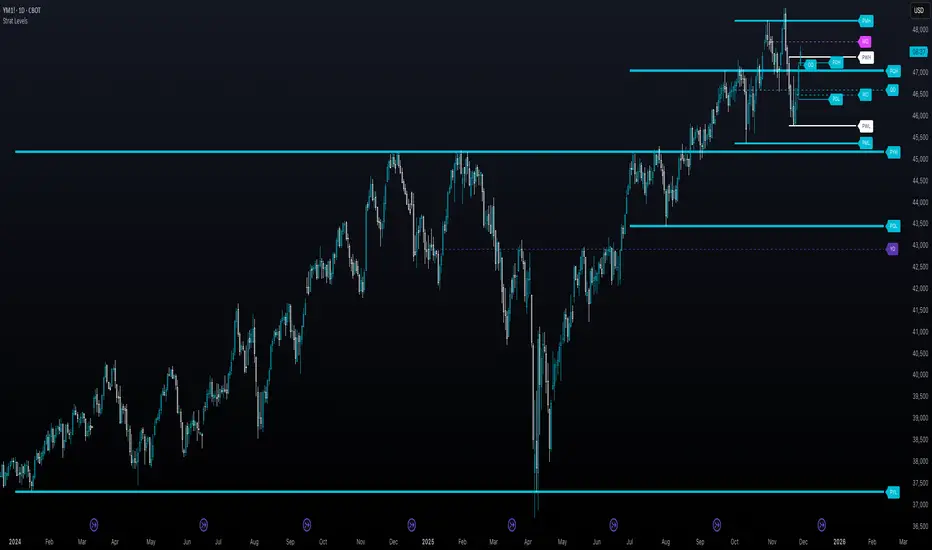
Indices ALN SessionsIndices ALN Sessions - Pattern Analysis with Historical Probabilities
Overview
This indicator analyzes overnight trading patterns across Asia, London, and New York sessions for major index futures (NQ, ES, YM), providing real-time probability analysis based on 15 years of historical data (2010-2025).
Pattern Detection Methodology
The indicator detects four distinct overnight patterns by comparing session high/low relationships:
1. London Engulfs Asia
Condition: London High > Asia High AND London Low < Asia Low
Interpretation: London session completely engulfed the Asia range
2. Asia Engulfs London
Condition: Asia High > London High AND Asia Low < London Low
Interpretation: London session remained within Asia's range
3. London Partial Up
Condition: London High > Asia High AND London Low ≥ Asia Low
Interpretation: London broke Asia high but not its low
4. London Partial Down
Condition: London Low < Asia Low AND London High ≤ Asia High
Interpretation: London broke Asia low but not the high
Probability Calculation
Probabilities are derived from historical analysis of 1-minute price data spanning 2010-2025 across all three indices. The system tracks:
Primary Targets: Most likely level to be taken during NY session based on pattern
Secondary Targets: Second most likely level
Asia Targets: Probability of reaching untouched Asia levels (for partial patterns)
Engulfment Probability: Likelihood of NY session taking all four levels
Day-of-Week Specificity
Each pattern has unique probability profiles for Monday through Friday, as market behavior varies significantly by day. The indicator automatically selects the appropriate probability set based on the current trading day.
Conditional Probability Logic
The indicator dynamically adjusts probabilities as levels are taken during the NY session:
When the Primary target is taken first → Shows conditional probability for Secondary target
When Secondary is taken before Primary → Adjusts Primary probability based on historical sequences
Real-time tracking shows which levels have been hit with checkmark confirmations
How Probabilities Were Derived
Data was collected from 15 years of 1-minute futures data for NQ, ES, and YM. For each trading day:
Asia session high/low recorded (8:00 PM - 2:00 AM EST)
London session high/low recorded (2:00 AM - 8:00 AM EST)
Pattern type classified
NY session behavior tracked (8:00 AM - 4:00 PM EST)
Level breaks recorded with sequence order
Statistical frequencies calculated by pattern, day, and instrument
Sample sizes vary but typically include 200-500+ occurrences per pattern/day combination over the 15-year period.
Visual Components
Session Boxes: Color-coded rectangles showing Asia (Yellow), London (Blue), and NY (Red) sessions with their high/low ranges.
Pivot Lines: Horizontal lines marking session highs and lows that extend until broken or until the drawing cutoff time.
Pattern Labels: Automatic labeling at NY open identifying which of the four patterns has formed.
Probability Table: Real-time table showing:
Current pattern type
Instrument type (NQ/ES/YM) and day of week
Sample size (when using dynamic stats)
Primary, Secondary, and Asia target probabilities
Engulfment probability
Live confirmations as levels are taken
Color Coding:
Green background: 70%+ probability
Lime: 50-70% probability
Orange: 30-50% probability
Red: Confirmed (level taken)
Settings & Inputs
Historical Stats
Instrument Type: Select NQ, ES, or YM (each has unique probability data)
Use Dynamic Stats: Toggle between historical probabilities and live collection mode
Sessions:
Customizable session times (default: Asia 8PM-2AM, London 2AM-8AM, NY 8AM-4PM EST)
Session box transparency and colors
Toggle session boxes and text on/off
Pivots:
Show/hide pivot lines and labels
Extend pivots until mitigated or past mitigation
Alert when pivots are broken
Midpoint display option
Probabilities:
Show/hide probability table
Table position and size customization
Pattern label display toggle
Opening Prices:
Optional horizontal lines at key times (midnight,18:00, 09:30, etc.)
How to Use:
Apply to 5-minute chart of NQ, ES, or YM futures
Select your instrument in settings to match the chart
Wait for NY session open - Pattern will be identified and probabilities displayed
Monitor the probability table - Primary targets show highest probability levels
Watch for confirmations - Checkmarks appear as levels are taken
Note conditional updates - Probabilities adjust based on which level breaks first
Trading Applications:
Directional bias: High probability targets suggest likely NY session movement
Level awareness: Know which session highs/lows are most likely to be tested
Risk management: Lower probability scenarios may warrant tighter stops
Sequence planning: Conditional probabilities help anticipate multi-level moves
What Makes This Different:
Unlike standard session indicators that only display ranges, this tool:
Classifies specific overnight pattern formations:
Provides quantified probabilities based on extensive historical analysis
Updates in real-time with conditional logic as the session develops
Distinguishes between different indices (NQ/ES/YM) and days of week
Tracks level-break sequences, not just final outcomes
Notes:
Probabilities are based on historical frequencies and do not guarantee future results
Best used on 1, 5, and 15-minute timeframes for optimal session visualization
Works on continuous futures contracts or /NQ, /ES, /YM symbols

Kripto Fema ind/ This Pine Script™ code is subject to the terms of the Mozilla Public License 2.0 at mozilla.org
// © Femayakup
//@version=5
indicator(title = "Kripto Fema ind", shorttitle="Kripto Fema ind", overlay=true, format=format.price, precision=2,max_lines_count = 500, max_labels_count = 500, max_bars_back=500)
showEma200 = input(true, title="EMA 200")
showPmax = input(true, title="Pmax")
showLinreg = input(true, title="Linreg")
showMavilim = input(true, title="Mavilim")
showNadaray = input(true, title="Nadaraya Watson")
ma(source, length, type) =>
switch type
"SMA" => ta.sma(source, length)
"EMA" => ta.ema(source, length)
"SMMA (RMA)" => ta.rma(source, length)
"WMA" => ta.wma(source, length)
"VWMA" => ta.vwma(source, length)
//Ema200
timeFrame = input.timeframe(defval = '240',title= 'EMA200 TimeFrame',group = 'EMA200 Settings')
len200 = input.int(200, minval=1, title="Length",group = 'EMA200 Settings')
src200 = input(close, title="Source",group = 'EMA200 Settings')
offset200 = input.int(title="Offset", defval=0, minval=-500, maxval=500,group = 'EMA200 Settings')
out200 = ta.ema(src200, len200)
higherTimeFrame = request.security(syminfo.tickerid,timeFrame,out200 ,barmerge.gaps_on,barmerge.lookahead_on)
ema200Plot = showEma200 ? higherTimeFrame : na
plot(ema200Plot, title="EMA200", offset=offset200)
//Linreq
group1 = "Linreg Settings"
lengthInput = input.int(100, title="Length", minval = 1, maxval = 5000,group = group1)
sourceInput = input.source(close, title="Source")
useUpperDevInput = input.bool(true, title="Upper Deviation", inline = "Upper Deviation", group = group1)
upperMultInput = input.float(2.0, title="", inline = "Upper Deviation", group = group1)
useLowerDevInput = input.bool(true, title="Lower Deviation", inline = "Lower Deviation", group = group1)
lowerMultInput = input.float(2.0, title="", inline = "Lower Deviation", group = group1)
group2 = "Linreg Display Settings"
showPearsonInput = input.bool(true, "Show Pearson's R", group = group2)
extendLeftInput = input.bool(false, "Extend Lines Left", group = group2)
extendRightInput = input.bool(true, "Extend Lines Right", group = group2)
extendStyle = switch
extendLeftInput and extendRightInput => extend.both
extendLeftInput => extend.left
extendRightInput => extend.right
=> extend.none
group3 = "Linreg Color Settings"
colorUpper = input.color(color.new(color.blue, 85), "Linreg Renk", inline = group3, group = group3)
colorLower = input.color(color.new(color.red, 85), "", inline = group3, group = group3)
calcSlope(source, length) =>
max_bars_back(source, 5000)
if not barstate.islast or length <= 1
else
sumX = 0.0
sumY = 0.0
sumXSqr = 0.0
sumXY = 0.0
for i = 0 to length - 1 by 1
val = source
per = i + 1.0
sumX += per
sumY += val
sumXSqr += per * per
sumXY += val * per
slope = (length * sumXY - sumX * sumY) / (length * sumXSqr - sumX * sumX)
average = sumY / length
intercept = average - slope * sumX / length + slope
= calcSlope(sourceInput, lengthInput)
startPrice = i + s * (lengthInput - 1)
endPrice = i
var line baseLine = na
if na(baseLine) and not na(startPrice) and showLinreg
baseLine := line.new(bar_index - lengthInput + 1, startPrice, bar_index, endPrice, width=1, extend=extendStyle, color=color.new(colorLower, 0))
else
line.set_xy1(baseLine, bar_index - lengthInput + 1, startPrice)
line.set_xy2(baseLine, bar_index, endPrice)
na
calcDev(source, length, slope, average, intercept) =>
upDev = 0.0
dnDev = 0.0
stdDevAcc = 0.0
dsxx = 0.0
dsyy = 0.0
dsxy = 0.0
periods = length - 1
daY = intercept + slope * periods / 2
val = intercept
for j = 0 to periods by 1
price = high - val
if price > upDev
upDev := price
price := val - low
if price > dnDev
dnDev := price
price := source
dxt = price - average
dyt = val - daY
price -= val
stdDevAcc += price * price
dsxx += dxt * dxt
dsyy += dyt * dyt
dsxy += dxt * dyt
val += slope
stdDev = math.sqrt(stdDevAcc / (periods == 0 ? 1 : periods))
pearsonR = dsxx == 0 or dsyy == 0 ? 0 : dsxy / math.sqrt(dsxx * dsyy)
= calcDev(sourceInput, lengthInput, s, a, i)
upperStartPrice = startPrice + (useUpperDevInput ? upperMultInput * stdDev : upDev)
upperEndPrice = endPrice + (useUpperDevInput ? upperMultInput * stdDev : upDev)
var line upper = na
lowerStartPrice = startPrice + (useLowerDevInput ? -lowerMultInput * stdDev : -dnDev)
lowerEndPrice = endPrice + (useLowerDevInput ? -lowerMultInput * stdDev : -dnDev)
var line lower = na
if na(upper) and not na(upperStartPrice) and showLinreg
upper := line.new(bar_index - lengthInput + 1, upperStartPrice, bar_index, upperEndPrice, width=1, extend=extendStyle, color=color.new(colorUpper, 0))
else
line.set_xy1(upper, bar_index - lengthInput + 1, upperStartPrice)
line.set_xy2(upper, bar_index, upperEndPrice)
na
if na(lower) and not na(lowerStartPrice) and showLinreg
lower := line.new(bar_index - lengthInput + 1, lowerStartPrice, bar_index, lowerEndPrice, width=1, extend=extendStyle, color=color.new(colorUpper, 0))
else
line.set_xy1(lower, bar_index - lengthInput + 1, lowerStartPrice)
line.set_xy2(lower, bar_index, lowerEndPrice)
na
showLinregPlotUpper = showLinreg ? upper : na
showLinregPlotLower = showLinreg ? lower : na
showLinregPlotBaseLine = showLinreg ? baseLine : na
linefill.new(showLinregPlotUpper, showLinregPlotBaseLine, color = colorUpper)
linefill.new(showLinregPlotBaseLine, showLinregPlotLower, color = colorLower)
// Pearson's R
var label r = na
label.delete(r )
if showPearsonInput and not na(pearsonR) and showLinreg
r := label.new(bar_index - lengthInput + 1, lowerStartPrice, str.tostring(pearsonR, "#.################"), color = color.new(color.white, 100), textcolor=color.new(colorUpper, 0), size=size.normal, style=label.style_label_up)
//Mavilim
group4 = "Mavilim Settings"
mavilimold = input(false, title="Show Previous Version of MavilimW?",group=group4)
fmal=input(3,"First Moving Average length",group = group4)
smal=input(5,"Second Moving Average length",group = group4)
tmal=fmal+smal
Fmal=smal+tmal
Ftmal=tmal+Fmal
Smal=Fmal+Ftmal
M1= ta.wma(close, fmal)
M2= ta.wma(M1, smal)
M3= ta.wma(M2, tmal)
M4= ta.wma(M3, Fmal)
M5= ta.wma(M4, Ftmal)
MAVW= ta.wma(M5, Smal)
col1= MAVW>MAVW
col3= MAVWpmaxsrc ? pmaxsrc-pmaxsrc : 0
vdd1=pmaxsrc
ma = 0.0
if mav == "SMA"
ma := ta.sma(pmaxsrc, length)
ma
if mav == "EMA"
ma := ta.ema(pmaxsrc, length)
ma
if mav == "WMA"
ma := ta.wma(pmaxsrc, length)
ma
if mav == "TMA"
ma := ta.sma(ta.sma(pmaxsrc, math.ceil(length / 2)), math.floor(length / 2) + 1)
ma
if mav == "VAR"
ma := VAR
ma
if mav == "WWMA"
ma := WWMA
ma
if mav == "ZLEMA"
ma := ZLEMA
ma
if mav == "TSF"
ma := TSF
ma
ma
MAvg=getMA(pmaxsrc, length)
longStop = Normalize ? MAvg - Multiplier*atr/close : MAvg - Multiplier*atr
longStopPrev = nz(longStop , longStop)
longStop := MAvg > longStopPrev ? math.max(longStop, longStopPrev) : longStop
shortStop = Normalize ? MAvg + Multiplier*atr/close : MAvg + Multiplier*atr
shortStopPrev = nz(shortStop , shortStop)
shortStop := MAvg < shortStopPrev ? math.min(shortStop, shortStopPrev) : shortStop
dir = 1
dir := nz(dir , dir)
dir := dir == -1 and MAvg > shortStopPrev ? 1 : dir == 1 and MAvg < longStopPrev ? -1 : dir
PMax = dir==1 ? longStop: shortStop
plot(showsupport ? MAvg : na, color=#fbff04, linewidth=2, title="EMA9")
pALL=plot(PMax, color=color.new(color.red, transp = 0), linewidth=2, title="PMax")
alertcondition(ta.cross(MAvg, PMax), title="Cross Alert", message="PMax - Moving Avg Crossing!")
alertcondition(ta.crossover(MAvg, PMax), title="Crossover Alarm", message="Moving Avg BUY SIGNAL!")
alertcondition(ta.crossunder(MAvg, PMax), title="Crossunder Alarm", message="Moving Avg SELL SIGNAL!")
alertcondition(ta.cross(pmaxsrc, PMax), title="Price Cross Alert", message="PMax - Price Crossing!")
alertcondition(ta.crossover(pmaxsrc, PMax), title="Price Crossover Alarm", message="PRICE OVER PMax - BUY SIGNAL!")
alertcondition(ta.crossunder(pmaxsrc, PMax), title="Price Crossunder Alarm", message="PRICE UNDER PMax - SELL SIGNAL!")
buySignalk = ta.crossover(MAvg, PMax)
plotshape(buySignalk and showsignalsk ? PMax*0.995 : na, title="Buy", text="Buy", location=location.absolute, style=shape.labelup, size=size.tiny, color=color.new(color.green, transp = 0), textcolor=color.white)
sellSignallk = ta.crossunder(MAvg, PMax)
plotshape(sellSignallk and showsignalsk ? PMax*1.005 : na, title="Sell", text="Sell", location=location.absolute, style=shape.labeldown, size=size.tiny, color=color.new(color.red, transp = 0), textcolor=color.white)
// buySignalc = ta.crossover(pmaxsrc, PMax)
// plotshape(buySignalc and showsignalsc ? PMax*0.995 : na, title="Buy", text="Buy", location=location.absolute, style=shape.labelup, size=size.tiny, color=#0F18BF, textcolor=color.white)
// sellSignallc = ta.crossunder(pmaxsrc, PMax)
// plotshape(sellSignallc and showsignalsc ? PMax*1.005 : na, title="Sell", text="Sell", location=location.absolute, style=shape.labeldown, size=size.tiny, color=#0F18BF, textcolor=color.white)
// mPlot = plot(ohlc4, title="", style=plot.style_circles, linewidth=0,display=display.none)
longFillColor = highlighting ? (MAvg>PMax ? color.new(color.green, transp = 90) : na) : na
shortFillColor = highlighting ? (MAvg math.exp(-(math.pow(x, 2)/(h * h * 2)))
//-----------------------------------------------------------------------------}
//Append lines
//-----------------------------------------------------------------------------{
n = bar_index
var ln = array.new_line(0)
if barstate.isfirst and repaint
for i = 0 to 499
array.push(ln,line.new(na,na,na,na))
//-----------------------------------------------------------------------------}
//End point method
//-----------------------------------------------------------------------------{
var coefs = array.new_float(0)
var den = 0.
if barstate.isfirst and not repaint
for i = 0 to 499
w = gauss(i, h)
coefs.push(w)
den := coefs.sum()
out = 0.
if not repaint
for i = 0 to 499
out += src * coefs.get(i)
out /= den
mae = ta.sma(math.abs(src - out), 499) * mult
upperN = out + mae
lowerN = out - mae
//-----------------------------------------------------------------------------}
//Compute and display NWE
//-----------------------------------------------------------------------------{
float y2 = na
float y1 = na
nwe = array.new(0)
if barstate.islast and repaint
sae = 0.
//Compute and set NWE point
for i = 0 to math.min(499,n - 1)
sum = 0.
sumw = 0.
//Compute weighted mean
for j = 0 to math.min(499,n - 1)
w = gauss(i - j, h)
sum += src * w
sumw += w
y2 := sum / sumw
sae += math.abs(src - y2)
nwe.push(y2)
sae := sae / math.min(499,n - 1) * mult
for i = 0 to math.min(499,n - 1)
if i%2 and showNadaray
line.new(n-i+1, y1 + sae, n-i, nwe.get(i) + sae, color = upCss)
line.new(n-i+1, y1 - sae, n-i, nwe.get(i) - sae, color = dnCss)
if src > nwe.get(i) + sae and src < nwe.get(i) + sae and showNadaray
label.new(n-i, src , '▼', color = color(na), style = label.style_label_down, textcolor = dnCss, textalign = text.align_center)
if src < nwe.get(i) - sae and src > nwe.get(i) - sae and showNadaray
label.new(n-i, src , '▲', color = color(na), style = label.style_label_up, textcolor = upCss, textalign = text.align_center)
y1 := nwe.get(i)
//-----------------------------------------------------------------------------}
//Dashboard
//-----------------------------------------------------------------------------{
var tb = table.new(position.top_right, 1, 1
, bgcolor = #1e222d
, border_color = #373a46
, border_width = 1
, frame_color = #373a46
, frame_width = 1)
if repaint
tb.cell(0, 0, 'Repainting Mode Enabled', text_color = color.white, text_size = size.small)
//-----------------------------------------------------------------------------}
//Plot
//-----------------------------------------------------------------------------}
// plot(repaint ? na : out + mae, 'Upper', upCss)
// plot(repaint ? na : out - mae, 'Lower', dnCss)
//Crossing Arrows
// plotshape(ta.crossunder(close, out - mae) ? low : na, "Crossunder", shape.labelup, location.absolute, color(na), 0 , text = '▲', textcolor = upCss, size = size.tiny)
// plotshape(ta.crossover(close, out + mae) ? high : na, "Crossover", shape.labeldown, location.absolute, color(na), 0 , text = '▼', textcolor = dnCss, size = size.tiny)
//-----------------------------------------------------------------------------}
//////////////////////////////////////////////////////////////////////////////////
enableD = input (true, "DIVERGANCE ON/OFF" , group="INDICATORS ON/OFF")
//DIVERGANCE
prd1 = input.int (defval=5 , title='PIVOT PERIOD' , minval=1, maxval=50 , group="DIVERGANCE")
source = input.string(defval='HIGH/LOW' , title='SOURCE FOR PIVOT POINTS' , options= , group="DIVERGANCE")
searchdiv = input.string(defval='REGULAR/HIDDEN', title='DIVERGANCE TYPE' , options= , group="DIVERGANCE")
showindis = input.string(defval='FULL' , title='SHOW INDICATORS NAME' , options= , group="DIVERGANCE")
showlimit = input.int(1 , title='MINIMUM NUMBER OF DIVERGANCES', minval=1, maxval=11 , group="DIVERGANCE")
maxpp = input.int (defval=20 , title='MAXIMUM PIVOT POINTS TO CHECK', minval=1, maxval=20 , group="DIVERGANCE")
maxbars = input.int (defval=200 , title='MAXIMUM BARS TO CHECK' , minval=30, maxval=200 , group="DIVERGANCE")
showlast = input (defval=false , title='SHOW ONLY LAST DIVERGANCE' , group="DIVERGANCE")
dontconfirm = input (defval=false , title="DON'T WAIT FOR CONFORMATION" , group="DIVERGANCE")
showlines = input (defval=false , title='SHOW DIVERGANCE LINES' , group="DIVERGANCE")
showpivot = input (defval=false , title='SHOW PIVOT POINTS' , group="DIVERGANCE")
calcmacd = input (defval=true , title='MACD' , group="DIVERGANCE")
calcmacda = input (defval=true , title='MACD HISTOGRAM' , group="DIVERGANCE")
calcrsi = input (defval=true , title='RSI' , group="DIVERGANCE")
calcstoc = input (defval=true , title='STOCHASTIC' , group="DIVERGANCE")
calccci = input (defval=true , title='CCI' , group="DIVERGANCE")
calcmom = input (defval=true , title='MOMENTUM' , group="DIVERGANCE")
calcobv = input (defval=true , title='OBV' , group="DIVERGANCE")
calcvwmacd = input (true , title='VWMACD' , group="DIVERGANCE")
calccmf = input (true , title='CHAIKIN MONEY FLOW' , group="DIVERGANCE")
calcmfi = input (true , title='MONEY FLOW INDEX' , group="DIVERGANCE")
calcext = input (false , title='CHECK EXTERNAL INDICATOR' , group="DIVERGANCE")
externalindi = input (defval=close , title='EXTERNAL INDICATOR' , group="DIVERGANCE")
pos_reg_div_col = input (defval=#ffffff , title='POSITIVE REGULAR DIVERGANCE' , group="DIVERGANCE")
neg_reg_div_col = input (defval=#00def6 , title='NEGATIVE REGULAR DIVERGANCE' , group="DIVERGANCE")
pos_hid_div_col = input (defval=#00ff0a , title='POSITIVE HIDDEN DIVERGANCE' , group="DIVERGANCE")
neg_hid_div_col = input (defval=#ff0015 , title='NEGATIVE HIDDEN DIVERGANCE' , group="DIVERGANCE")
reg_div_l_style_ = input.string(defval='SOLID' , title='REGULAR DIVERGANCE LINESTYLE' , options= , group="DIVERGANCE")
hid_div_l_style_ = input.string(defval='SOLID' , title='HIDDEN DIVERGANCE LINESTYLE' , options= , group="DIVERGANCE")
reg_div_l_width = input.int (defval=2 , title='REGULAR DIVERGANCE LINEWIDTH' , minval=1, maxval=5 , group="DIVERGANCE")
hid_div_l_width = input.int (defval=2 , title='HIDDEN DIVERGANCE LINEWIDTH' , minval=1, maxval=5 , group="DIVERGANCE")
showmas = input.bool (defval=false , title='SHOW MOVING AVERAGES (50 & 200)', inline='MA' , group="DIVERGANCE")
cma1col = input.color (defval=#ffffff , title='' , inline='MA' , group="DIVERGANCE")
cma2col = input.color (defval=#00def6 , title='' , inline='MA' , group="DIVERGANCE")
//PLOTS
plot(showmas ? ta.sma(close, 50) : na, color=showmas ? cma1col : na)
plot(showmas ? ta.sma(close, 200) : na, color=showmas ? cma2col : na)
var reg_div_l_style = reg_div_l_style_ == 'SOLID' ? line.style_solid : reg_div_l_style_ == 'DASHED' ? line.style_dashed : line.style_dotted
var hid_div_l_style = hid_div_l_style_ == 'SOLID' ? line.style_solid : hid_div_l_style_ == 'DASHED' ? line.style_dashed : line.style_dotted
rsi = ta.rsi(close, 14)
= ta.macd(close, 12, 26, 9)
moment = ta.mom(close, 10)
cci = ta.cci(close, 10)
Obv = ta.obv
stk = ta.sma(ta.stoch(close, high, low, 14), 3)
maFast = ta.vwma(close, 12)
maSlow = ta.vwma(close, 26)
vwmacd = maFast - maSlow
Cmfm = (close - low - (high - close)) / (high - low)
Cmfv = Cmfm * volume
cmf = ta.sma(Cmfv, 21) / ta.sma(volume, 21)
Mfi = ta.mfi(close, 14)
var indicators_name = array.new_string(11)
var div_colors = array.new_color(4)
if barstate.isfirst and enableD
array.set(indicators_name, 0, showindis == "DON'T SHOW" ? '' : '')
array.set(indicators_name, 1, showindis == "DON'T SHOW" ? '' : '')
array.set(indicators_name, 2, showindis == "DON'T SHOW" ? '' : '')
array.set(indicators_name, 3, showindis == "DON'T SHOW" ? '' : '')
array.set(indicators_name, 4, showindis == "DON'T SHOW" ? '' : '')
array.set(indicators_name, 5, showindis == "DON'T SHOW" ? '' : '')
array.set(indicators_name, 6, showindis == "DON'T SHOW" ? '' : '')
array.set(indicators_name, 7, showindis == "DON'T SHOW" ? '' : '')
array.set(indicators_name, 8, showindis == "DON'T SHOW" ? '' : '')
array.set(indicators_name, 9, showindis == "DON'T SHOW" ? '' : '')
array.set(indicators_name, 10, showindis == "DON'T SHOW" ? '' : '')
array.set(div_colors, 0, pos_reg_div_col)
array.set(div_colors, 1, neg_reg_div_col)
array.set(div_colors, 2, pos_hid_div_col)
array.set(div_colors, 3, neg_hid_div_col)
float ph1 = ta.pivothigh(source == 'CLOSE' ? close : high, prd1, prd1)
float pl1 = ta.pivotlow(source == 'CLOSE' ? close : low, prd1, prd1)
plotshape(ph1 and showpivot, text='H', style=shape.labeldown, color=color.new(color.white, 100), textcolor=#00def6, location=location.abovebar, offset=-prd1)
plotshape(pl1 and showpivot, text='L', style=shape.labelup, color=color.new(color.white, 100), textcolor=#ffffff, location=location.belowbar, offset=-prd1)
var int maxarraysize = 20
var ph_positions = array.new_int(maxarraysize, 0)
var pl_positions = array.new_int(maxarraysize, 0)
var ph_vals = array.new_float(maxarraysize, 0.)
var pl_vals = array.new_float(maxarraysize, 0.)
if ph1
array.unshift(ph_positions, bar_index)
array.unshift(ph_vals, ph1)
if array.size(ph_positions) > maxarraysize
array.pop(ph_positions)
array.pop(ph_vals)
if pl1
array.unshift(pl_positions, bar_index)
array.unshift(pl_vals, pl1)
if array.size(pl_positions) > maxarraysize
array.pop(pl_positions)
array.pop(pl_vals)
positive_regular_positive_hidden_divergence(src, cond) =>
divlen = 0
prsc = source == 'CLOSE' ? close : low
if dontconfirm or src > src or close > close
startpoint = dontconfirm ? 0 : 1
for x = 0 to maxpp - 1 by 1
len = bar_index - array.get(pl_positions, x) + prd1
if array.get(pl_positions, x) == 0 or len > maxbars
break
if len > 5 and (cond == 1 and src > src and prsc < nz(array.get(pl_vals, x)) or cond == 2 and src < src and prsc > nz(array.get(pl_vals, x)))
slope1 = (src - src ) / (len - startpoint)
virtual_line1 = src - slope1
slope2 = (close - close ) / (len - startpoint)
virtual_line2 = close - slope2
arrived = true
for y = 1 + startpoint to len - 1 by 1
if src < virtual_line1 or nz(close ) < virtual_line2
arrived := false
break
virtual_line1 -= slope1
virtual_line2 -= slope2
virtual_line2
if arrived
divlen := len
break
divlen
negative_regular_negative_hidden_divergence(src, cond) =>
divlen = 0
prsc = source == 'CLOSE' ? close : high
if dontconfirm or src < src or close < close
startpoint = dontconfirm ? 0 : 1
for x = 0 to maxpp - 1 by 1
len = bar_index - array.get(ph_positions, x) + prd1
if array.get(ph_positions, x) == 0 or len > maxbars
break
if len > 5 and (cond == 1 and src < src and prsc > nz(array.get(ph_vals, x)) or cond == 2 and src > src and prsc < nz(array.get(ph_vals, x)))
slope1 = (src - src ) / (len - startpoint)
virtual_line1 = src - slope1
slope2 = (close - nz(close )) / (len - startpoint)
virtual_line2 = close - slope2
arrived = true
for y = 1 + startpoint to len - 1 by 1
if src > virtual_line1 or nz(close ) > virtual_line2
arrived := false
break
virtual_line1 -= slope1
virtual_line2 -= slope2
virtual_line2
if arrived
divlen := len
break
divlen
//CALCULATIONS
calculate_divs(cond, indicator_1) =>
divs = array.new_int(4, 0)
array.set(divs, 0, cond and (searchdiv == 'REGULAR' or searchdiv == 'REGULAR/HIDDEN') ? positive_regular_positive_hidden_divergence(indicator_1, 1) : 0)
array.set(divs, 1, cond and (searchdiv == 'REGULAR' or searchdiv == 'REGULAR/HIDDEN') ? negative_regular_negative_hidden_divergence(indicator_1, 1) : 0)
array.set(divs, 2, cond and (searchdiv == 'HIDDEN' or searchdiv == 'REGULAR/HIDDEN') ? positive_regular_positive_hidden_divergence(indicator_1, 2) : 0)
array.set(divs, 3, cond and (searchdiv == 'HIDDEN' or searchdiv == 'REGULAR/HIDDEN') ? negative_regular_negative_hidden_divergence(indicator_1, 2) : 0)
divs
var all_divergences = array.new_int(44)
array_set_divs(div_pointer, index) =>
for x = 0 to 3 by 1
array.set(all_divergences, index * 4 + x, array.get(div_pointer, x))
array_set_divs(calculate_divs(calcmacd , macd) , 0)
array_set_divs(calculate_divs(calcmacda , deltamacd) , 1)
array_set_divs(calculate_divs(calcrsi , rsi) , 2)
array_set_divs(calculate_divs(calcstoc , stk) , 3)
array_set_divs(calculate_divs(calccci , cci) , 4)
array_set_divs(calculate_divs(calcmom , moment) , 5)
array_set_divs(calculate_divs(calcobv , Obv) , 6)
array_set_divs(calculate_divs(calcvwmacd, vwmacd) , 7)
array_set_divs(calculate_divs(calccmf , cmf) , 8)
array_set_divs(calculate_divs(calcmfi , Mfi) , 9)
array_set_divs(calculate_divs(calcext , externalindi), 10)
total_div = 0
for x = 0 to array.size(all_divergences) - 1 by 1
total_div += math.round(math.sign(array.get(all_divergences, x)))
total_div
if total_div < showlimit
array.fill(all_divergences, 0)
var pos_div_lines = array.new_line(0)
var neg_div_lines = array.new_line(0)
var pos_div_labels = array.new_label(0)
var neg_div_labels = array.new_label(0)
delete_old_pos_div_lines() =>
if array.size(pos_div_lines) > 0
for j = 0 to array.size(pos_div_lines) - 1 by 1
line.delete(array.get(pos_div_lines, j))
array.clear(pos_div_lines)
delete_old_neg_div_lines() =>
if array.size(neg_div_lines) > 0
for j = 0 to array.size(neg_div_lines) - 1 by 1
line.delete(array.get(neg_div_lines, j))
array.clear(neg_div_lines)
delete_old_pos_div_labels() =>
if array.size(pos_div_labels) > 0
for j = 0 to array.size(pos_div_labels) - 1 by 1
label.delete(array.get(pos_div_labels, j))
array.clear(pos_div_labels)
delete_old_neg_div_labels() =>
if array.size(neg_div_labels) > 0
for j = 0 to array.size(neg_div_labels) - 1 by 1
label.delete(array.get(neg_div_labels, j))
array.clear(neg_div_labels)
delete_last_pos_div_lines_label(n) =>
if n > 0 and array.size(pos_div_lines) >= n
asz = array.size(pos_div_lines)
for j = 1 to n by 1
line.delete(array.get(pos_div_lines, asz - j))
array.pop(pos_div_lines)
if array.size(pos_div_labels) > 0
label.delete(array.get(pos_div_labels, array.size(pos_div_labels) - 1))
array.pop(pos_div_labels)
delete_last_neg_div_lines_label(n) =>
if n > 0 and array.size(neg_div_lines) >= n
asz = array.size(neg_div_lines)
for j = 1 to n by 1
line.delete(array.get(neg_div_lines, asz - j))
array.pop(neg_div_lines)
if array.size(neg_div_labels) > 0
label.delete(array.get(neg_div_labels, array.size(neg_div_labels) - 1))
array.pop(neg_div_labels)
pos_reg_div_detected = false
neg_reg_div_detected = false
pos_hid_div_detected = false
neg_hid_div_detected = false
var last_pos_div_lines = 0
var last_neg_div_lines = 0
var remove_last_pos_divs = false
var remove_last_neg_divs = false
if pl1
remove_last_pos_divs := false
last_pos_div_lines := 0
last_pos_div_lines
if ph1
remove_last_neg_divs := false
last_neg_div_lines := 0
last_neg_div_lines
divergence_text_top = ''
divergence_text_bottom = ''
distances = array.new_int(0)
dnumdiv_top = 0
dnumdiv_bottom = 0
top_label_col = color.white
bottom_label_col = color.white
old_pos_divs_can_be_removed = true
old_neg_divs_can_be_removed = true
startpoint = dontconfirm ? 0 : 1
for x = 0 to 10 by 1
div_type = -1
for y = 0 to 3 by 1
if array.get(all_divergences, x * 4 + y) > 0
div_type := y
if y % 2 == 1
dnumdiv_top += 1
top_label_col := array.get(div_colors, y)
top_label_col
if y % 2 == 0
dnumdiv_bottom += 1
bottom_label_col := array.get(div_colors, y)
bottom_label_col
if not array.includes(distances, array.get(all_divergences, x * 4 + y))
array.push(distances, array.get(all_divergences, x * 4 + y))
new_line = showlines ? line.new(x1=bar_index - array.get(all_divergences, x * 4 + y), y1=source == 'CLOSE' ? close : y % 2 == 0 ? low : high , x2=bar_index - startpoint, y2=source == 'CLOSE' ? close : y % 2 == 0 ? low : high , color=array.get(div_colors, y), style=y < 2 ? reg_div_l_style : hid_div_l_style, width=y < 2 ? reg_div_l_width : hid_div_l_width) : na
if y % 2 == 0
if old_pos_divs_can_be_removed
old_pos_divs_can_be_removed := false
if not showlast and remove_last_pos_divs
delete_last_pos_div_lines_label(last_pos_div_lines)
last_pos_div_lines := 0
last_pos_div_lines
if showlast
delete_old_pos_div_lines()
array.push(pos_div_lines, new_line)
last_pos_div_lines += 1
remove_last_pos_divs := true
remove_last_pos_divs
if y % 2 == 1
if old_neg_divs_can_be_removed
old_neg_divs_can_be_removed := false
if not showlast and remove_last_neg_divs
delete_last_neg_div_lines_label(last_neg_div_lines)
last_neg_div_lines := 0
last_neg_div_lines
if showlast
delete_old_neg_div_lines()
array.push(neg_div_lines, new_line)
last_neg_div_lines += 1
remove_last_neg_divs := true
remove_last_neg_divs
if y == 0
pos_reg_div_detected := true
pos_reg_div_detected
if y == 1
neg_reg_div_detected := true
neg_reg_div_detected
if y == 2
pos_hid_div_detected := true
pos_hid_div_detected
if y == 3
neg_hid_div_detected := true
neg_hid_div_detected
if div_type >= 0
divergence_text_top += (div_type % 2 == 1 ? showindis != "DON'T SHOW" ? array.get(indicators_name, x) + '\n' : '' : '')
divergence_text_bottom += (div_type % 2 == 0 ? showindis != "DON'T SHOW" ? array.get(indicators_name, x) + '\n' : '' : '')
divergence_text_bottom
if showindis != "DON'T SHOW"
if dnumdiv_top > 0
divergence_text_top += str.tostring(dnumdiv_top)
divergence_text_top
if dnumdiv_bottom > 0
divergence_text_bottom += str.tostring(dnumdiv_bottom)
divergence_text_bottom
if divergence_text_top != ''
if showlast
delete_old_neg_div_labels()
array.push(neg_div_labels, label.new(x=bar_index, y=math.max(high, high ), color=top_label_col, style=label.style_diamond, size = size.auto))
if divergence_text_bottom != ''
if showlast
delete_old_pos_div_labels()
array.push(pos_div_labels, label.new(x=bar_index, y=math.min(low, low ), color=bottom_label_col, style=label.style_diamond, size = size.auto))
// POSITION AND SIZE
PosTable = input.string(defval="Bottom Right", title="Position", options= , group="Table Location & Size", inline="1")
SizTable = input.string(defval="Auto", title="Size", options= , group="Table Location & Size", inline="1")
Pos1Table = PosTable == "Top Right" ? position.top_right : PosTable == "Middle Right" ? position.middle_right : PosTable == "Bottom Right" ? position.bottom_right : PosTable == "Top Center" ? position.top_center : PosTable == "Middle Center" ? position.middle_center : PosTable == "Bottom Center" ? position.bottom_center : PosTable == "Top Left" ? position.top_left : PosTable == "Middle Left" ? position.middle_left : position.bottom_left
Siz1Table = SizTable == "Auto" ? size.auto : SizTable == "Huge" ? size.huge : SizTable == "Large" ? size.large : SizTable == "Normal" ? size.normal : SizTable == "Small" ? size.small : size.tiny
tbl = table.new(Pos1Table, 21, 16, border_width = 1, border_color = color.gray, frame_color = color.gray, frame_width = 1)
// Kullanıcı tarafından belirlenecek yeşil ve kırmızı zaman dilimi sayısı
greenThreshold = input.int(5, minval=1, maxval=10, title="Yeşil Zaman Dilimi Sayısı", group="Alarm Ayarları")
redThreshold = input.int(5, minval=1, maxval=10, title="Kırmızı Zaman Dilimi Sayısı", group="Alarm Ayarları")
// TIMEFRAMES OPTIONS
box01 = input.bool(true, "TF ", inline = "01", group="Select Timeframe")
tf01 = input.timeframe("1", "", inline = "01", group="Select Timeframe")
box02 = input.bool(false, "TF ", inline = "02", group="Select Timeframe")
tf02 = input.timeframe("3", "", inline = "02", group="Select Timeframe")
box03 = input.bool(true, "TF ", inline = "03", group="Select Timeframe")
tf03 = input.timeframe("5", "", inline = "03", group="Select Timeframe")
box04 = input.bool(true, "TF ", inline = "04", group="Select Timeframe")
tf04 = input.timeframe("15", "", inline = "04", group="Select Timeframe")
box05 = input.bool(false, "TF ", inline = "05", group="Select Timeframe")
tf05 = input.timeframe("30", "", inline = "05", group="Select Timeframe")
box06 = input.bool(true, "TF ", inline = "01", group="Select Timeframe")
tf06 = input.timeframe("60", "", inline = "01", group="Select Timeframe")
box07 = input.bool(false, "TF ", inline = "02", group="Select Timeframe")
tf07 = input.timeframe("120", "", inline = "02", group="Select Timeframe")
box08 = input.bool(false, "TF ", inline = "03", group="Select Timeframe")
tf08 = input.timeframe("180", "", inline = "03", group="Select Timeframe")
box09 = input.bool(true, "TF ", inline = "04", group="Select Timeframe")
tf09 = input.timeframe("240", "", inline = "04", group="Select Timeframe")
box10 = input.bool(false, "TF ", inline = "05", group="Select Timeframe")
tf10 = input.timeframe("D", "", inline = "05", group="Select Timeframe")
// indicator('Tillson FEMA', overlay=true)
length1 = input(1, 'FEMA Length')
a1 = input(0.7, 'Volume Factor')
e1 = ta.ema((high + low + 2 * close) / 4, length1)
e2 = ta.ema(e1, length1)
e3 = ta.ema(e2, length1)
e4 = ta.ema(e3, length1)
e5 = ta.ema(e4, length1)
e6 = ta.ema(e5, length1)
c1 = -a1 * a1 * a1
c2 = 3 * a1 * a1 + 3 * a1 * a1 * a1
c3 = -6 * a1 * a1 - 3 * a1 - 3 * a1 * a1 * a1
c4 = 1 + 3 * a1 + a1 * a1 * a1 + 3 * a1 * a1
FEMA = c1 * e6 + c2 * e5 + c3 * e4 + c4 * e3
tablocol1 = FEMA > FEMA
tablocol3 = FEMA < FEMA
color_1 = col1 ? color.rgb(149, 219, 35): col3 ? color.rgb(238, 11, 11) : color.yellow
plot(FEMA, color=color_1, linewidth=3, title='FEMA')
tilson1 = FEMA
tilson1a =FEMA
// DEFINITION OF VALUES
symbol = ticker.modify(syminfo.tickerid, syminfo.session)
tfArr = array.new(na)
tilson1Arr = array.new(na)
tilson1aArr = array.new(na)
// DEFINITIONS OF RSI & CCI FUNCTIONS APPENDED IN THE TIMEFRAME OPTIONS
cciNcciFun(tf, flg) =>
= request.security(symbol, tf, )
if flg and (barstate.isrealtime ? true : timeframe.in_seconds(timeframe.period) <= timeframe.in_seconds(tf))
array.push(tfArr, na(tf) ? timeframe.period : tf)
array.push(tilson1Arr, tilson_)
array.push(tilson1aArr, tilson1a_)
cciNcciFun(tf01, box01), cciNcciFun(tf02, box02), cciNcciFun(tf03, box03), cciNcciFun(tf04, box04),
cciNcciFun(tf05, box05), cciNcciFun(tf06, box06), cciNcciFun(tf07, box07), cciNcciFun(tf08, box08),
cciNcciFun(tf09, box09), cciNcciFun(tf10, box10)
// TABLE AND CELLS CONFIG
// Post Timeframe in format
tfTxt(x)=>
out = x
if not str.contains(x, "S") and not str.contains(x, "M") and
not str.contains(x, "W") and not str.contains(x, "D")
if str.tonumber(x)%60 == 0
out := str.tostring(str.tonumber(x)/60)+"H"
else
out := x + "m"
out
if barstate.islast
table.clear(tbl, 0, 0, 20, 15)
// TITLES
table.cell(tbl, 0, 0, "⏱", text_color=color.white, text_size=Siz1Table, bgcolor=#000000)
table.cell(tbl, 1, 0, "FEMA("+str.tostring(length1)+")", text_color=#FFFFFF, text_size=Siz1Table, bgcolor=#000000)
j = 1
greenCounter = 0 // Yeşil zaman dilimlerini saymak için bir sayaç
redCounter = 0
if array.size(tilson1Arr) > 0
for i = 0 to array.size(tilson1Arr) - 1
if not na(array.get(tilson1Arr, i))
//config values in the cells
TF_VALUE = array.get(tfArr,i)
tilson1VALUE = array.get(tilson1Arr, i)
tilson1aVALUE = array.get(tilson1aArr, i)
SIGNAL1 = tilson1VALUE >= tilson1aVALUE ? "▲" : tilson1VALUE <= tilson1aVALUE ? "▼" : na
// Yeşil oklar ve arka planı ayarla
greenArrowColor1 = SIGNAL1 == "▲" ? color.rgb(0, 255, 0) : color.rgb(255, 0, 0)
greenBgColor1 = SIGNAL1 == "▲" ? color.rgb(25, 70, 22) : color.rgb(93, 22, 22)
allGreen = tilson1VALUE >= tilson1aVALUE
allRed = tilson1VALUE <= tilson1aVALUE
// Determine background color for time text
timeBgColor = allGreen ? #194616 : (allRed ? #5D1616 : #000000)
txtColor = allGreen ? #00FF00 : (allRed ? #FF4500 : color.white)
if allGreen
greenCounter := greenCounter + 1
redCounter := 0
else if allRed
redCounter := redCounter + 1
greenCounter := 0
else
redCounter := 0
greenCounter := 0
// Dinamik pair değerini oluşturma
pair = "USDT_" + syminfo.basecurrency + "USDT"
// Bot ID için kullanıcı girişi
bot_id = input.int(12387976, title="Bot ID", minval=0,group ='3Comas Message', inline = '1') // Varsayılan değeri 12387976 olan bir tamsayı girişi alır
// E-posta tokenı için kullanıcı girişi
email_token = input("cd4111d4-549a-4759-a082-e8f45c91fa47", title="Email Token",group ='3Comas Message', inline = '1')
// USER INPUT FOR DELAY
delay_seconds = input.int(0, title="Delay Seconds", minval=0, maxval=86400,group ='3Comas Message', inline = '1')
// Dinamik mesajın oluşturulması
message = '{ "message_type": "bot", "bot_id": ' + str.tostring(bot_id) + ', "email_token": "' + email_token + '", "delay_seconds": ' + str.tostring(delay_seconds) + ', "pair": "' + pair + '"}'
// Kullanıcının belirlediği yeşil veya kırmızı zaman dilimi sayısına ulaşıldığında alarmı tetikle
if greenCounter >= greenThreshold
alert(message, alert.freq_once_per_bar_close)
// if redCounter >= redThreshold
// alert(message, alert.freq_once_per_bar_close)
// Kullanıcının belirlediği yeşil veya kırmızı zaman dilimi sayısına ulaşıldığında alarmı tetikle
// if greenCounter >= greenThreshold
// alert("Yeşil zaman dilimi sayısı " + str.tostring(greenThreshold) + " adede ulaştı", alert.freq_once_per_bar_close)
// if redCounter >= redThreshold
// alert("Kırmızı zaman dilimi sayısı " + str.tostring(redThreshold) + " adede ulaştı", alert.freq_once_per_bar_close)
table.cell(tbl, 0, j, tfTxt(TF_VALUE), text_color=txtColor, text_halign=text.align_left, text_size=Siz1Table, bgcolor=timeBgColor)
table.cell(tbl, 1, j, str.tostring(tilson1VALUE, "#.#######")+SIGNAL1, text_color=greenArrowColor1, text_halign=text.align_right, text_size=Siz1Table, bgcolor=greenBgColor1)
j += 1
prd = input.int(defval=10, title='Pivot Period', minval=4, maxval=30, group='Setup')
ppsrc = input.string(defval='High/Low', title='Source', options= , group='Setup')
maxnumpp = input.int(defval=20, title=' Maximum Number of Pivot', minval=5, maxval=100, group='Setup')
ChannelW = input.int(defval=10, title='Maximum Channel Width %', minval=1, group='Setup')
maxnumsr = input.int(defval=5, title=' Maximum Number of S/R', minval=1, maxval=10, group='Setup')
min_strength = input.int(defval=2, title=' Minimum Strength', minval=1, maxval=10, group='Setup')
labelloc = input.int(defval=20, title='Label Location', group='Colors', tooltip='Positive numbers reference future bars, negative numbers reference histical bars')
linestyle = input.string(defval='Dashed', title='Line Style', options= , group='Colors')
linewidth = input.int(defval=2, title='Line Width', minval=1, maxval=4, group='Colors')
resistancecolor = input.color(defval=color.red, title='Resistance Color', group='Colors')
supportcolor = input.color(defval=color.lime, title='Support Color', group='Colors')
showpp = input(false, title='Show Point Points')
float src1 = ppsrc == 'High/Low' ? high : math.max(close, open)
float src2 = ppsrc == 'High/Low' ? low : math.min(close, open)
float ph = ta.pivothigh(src1, prd, prd)
float pl = ta.pivotlow(src2, prd, prd)
plotshape(ph and showpp, text='H', style=shape.labeldown, color=na, textcolor=color.new(color.red, 0), location=location.abovebar, offset=-prd)
plotshape(pl and showpp, text='L', style=shape.labelup, color=na, textcolor=color.new(color.lime, 0), location=location.belowbar, offset=-prd)
Lstyle = linestyle == 'Dashed' ? line.style_dashed : linestyle == 'Solid' ? line.style_solid : line.style_dotted
//calculate maximum S/R channel zone width
prdhighest = ta.highest(300)
prdlowest = ta.lowest(300)
cwidth = (prdhighest - prdlowest) * ChannelW / 100
var pivotvals = array.new_float(0)
if ph or pl
array.unshift(pivotvals, ph ? ph : pl)
if array.size(pivotvals) > maxnumpp // limit the array size
array.pop(pivotvals)
get_sr_vals(ind) =>
float lo = array.get(pivotvals, ind)
float hi = lo
int numpp = 0
for y = 0 to array.size(pivotvals) - 1 by 1
float cpp = array.get(pivotvals, y)
float wdth = cpp <= lo ? hi - cpp : cpp - lo
if wdth <= cwidth // fits the max channel width?
if cpp <= hi
lo := math.min(lo, cpp)
else
hi := math.max(hi, cpp)
numpp += 1
numpp
var sr_up_level = array.new_float(0)
var sr_dn_level = array.new_float(0)
sr_strength = array.new_float(0)
find_loc(strength) =>
ret = array.size(sr_strength)
for i = ret > 0 ? array.size(sr_strength) - 1 : na to 0 by 1
if strength <= array.get(sr_strength, i)
break
ret := i
ret
ret
check_sr(hi, lo, strength) =>
ret = true
for i = 0 to array.size(sr_up_level) > 0 ? array.size(sr_up_level) - 1 : na by 1
//included?
if array.get(sr_up_level, i) >= lo and array.get(sr_up_level, i) <= hi or array.get(sr_dn_level, i) >= lo and array.get(sr_dn_level, i) <= hi
if strength >= array.get(sr_strength, i)
array.remove(sr_strength, i)
array.remove(sr_up_level, i)
array.remove(sr_dn_level, i)
ret
else
ret := false
ret
break
ret
var sr_lines = array.new_line(11, na)
var sr_labels = array.new_label(11, na)
for x = 1 to 10 by 1
rate = 100 * (label.get_y(array.get(sr_labels, x)) - close) / close
label.set_text(array.get(sr_labels, x), text=str.tostring(label.get_y(array.get(sr_labels, x))) + '(' + str.tostring(rate, '#.##') + '%)')
label.set_x(array.get(sr_labels, x), x=bar_index + labelloc)
label.set_color(array.get(sr_labels, x), color=label.get_y(array.get(sr_labels, x)) >= close ? color.red : color.lime)
label.set_textcolor(array.get(sr_labels, x), textcolor=label.get_y(array.get(sr_labels, x)) >= close ? color.white : color.black)
label.set_style(array.get(sr_labels, x), style=label.get_y(array.get(sr_labels, x)) >= close ? label.style_label_down : label.style_label_up)
line.set_color(array.get(sr_lines, x), color=line.get_y1(array.get(sr_lines, x)) >= close ? resistancecolor : supportcolor)
if ph or pl
//because of new calculation, remove old S/R levels
array.clear(sr_up_level)
array.clear(sr_dn_level)
array.clear(sr_strength)
//find S/R zones
for x = 0 to array.size(pivotvals) - 1 by 1
= get_sr_vals(x)
if check_sr(hi, lo, strength)
loc = find_loc(strength)
// if strength is in first maxnumsr sr then insert it to the arrays
if loc < maxnumsr and strength >= min_strength
array.insert(sr_strength, loc, strength)
array.insert(sr_up_level, loc, hi)
array.insert(sr_dn_level, loc, lo)
// keep size of the arrays = 5
if array.size(sr_strength) > maxnumsr
array.pop(sr_strength)
array.pop(sr_up_level)
array.pop(sr_dn_level)
for x = 1 to 10 by 1
line.delete(array.get(sr_lines, x))
label.delete(array.get(sr_labels, x))
for x = 0 to array.size(sr_up_level) > 0 ? array.size(sr_up_level) - 1 : na by 1
float mid = math.round_to_mintick((array.get(sr_up_level, x) + array.get(sr_dn_level, x)) / 2)
rate = 100 * (mid - close) / close
array.set(sr_labels, x + 1, label.new(x=bar_index + labelloc, y=mid, text=str.tostring(mid) + '(' + str.tostring(rate, '#.##') + '%)', color=mid >= close ? color.red : color.lime, textcolor=mid >= close ? color.white : color.black, style=mid >= close ? label.style_label_down : label.style_label_up))
array.set(sr_lines, x + 1, line.new(x1=bar_index, y1=mid, x2=bar_index - 1, y2=mid, extend=extend.both, color=mid >= close ? resistancecolor : supportcolor, style=Lstyle, width=linewidth))
f_crossed_over() =>
ret = false
for x = 0 to array.size(sr_up_level) > 0 ? array.size(sr_up_level) - 1 : na by 1
float mid = math.round_to_mintick((array.get(sr_up_level, x) + array.get(sr_dn_level, x)) / 2)
if close <= mid and close > mid
ret := true
ret
ret
f_crossed_under() =>
ret = false
for x = 0 to array.size(sr_up_level) > 0 ? array.size(sr_up_level) - 1 : na by 1
float mid = math.round_to_mintick((array.get(sr_up_level, x) + array.get(sr_dn_level, x)) / 2)
if close >= mid and close < mid
ret := true
ret
ret
alertcondition(f_crossed_over(), title='Resistance Broken', message='Resistance Broken')
alertcondition(f_crossed_under(), title='Support Broken', message='Support Broken')

ICT/SMC DOL Detector PRO (Final)This indicator is designed to operate only on the 1-hour timeframe.
The ICT/SMC DOL Detector PRO is an educational indicator designed to identify and visualize Draw on Liquidity (DOL) levels across multiple time-frames. It tracks unmitigated daily highs and lows, clusters them into zones, and calculates confidence scores based on multiple factors including time decay, cluster size, and time-frame alignment.
This indicator is based on ICT (Inner Circle Trader) concepts and liquidity theory, which suggests that price tends to seek out areas of concentrated unfilled orders before reversing or continuing its trend.
What is a DOL (Draw on Liquidity)?
A Draw on Liquidity represents a daily high or low that has not been revisited (mitigated) by price. These levels act as "magnets" that draw price toward them because:
1. They represent untapped liquidity pools where unfilled orders exist
2. Market makers and institutions often target these levels to fill large orders
3. Price is drawn to these zones to clear pending orders
4. They can serve as potential reversal or continuation zones once liquidity is taken
Methodology
1. Level Tracking
The indicator monitors daily session highs and lows on the 1-hour time-frame, tracking:
- Session high price and time of formation
- Session low price and time of formation
- Whether each level has been breached (mitigated)
- Time elapsed since level formation
2. Clustering Algorithm
Unmitigated levels within a defined tolerance (default 0.5% of price) are grouped together to identify zones where multiple DOLs cluster. Larger clusters indicate stronger liquidity pools.
3. Confidence Scoring (The "AI" Logic)
Each DOL receives a confidence score (0-100%) based on three weighted factors. This is the core "AI" intelligence of the indicator:
**Factor 1: Cluster Size (50% weight)**
- Counts how many unmitigated levels exist within 0.5% of the price zone
- Formula: (levels_in_cluster / total_unmitigated_levels) × 50
- Logic: More unfilled orders clustered together = stronger liquidity pool = higher confidence
- Example: If 5 out of 10 total unmitigated levels cluster at 27,500, cluster score = (5/10) × 50 = 25%
**Factor 2: Time Decay (25% weight)**
- Calculates age of the level since formation
- Fresh levels (< 1 week old): Full 25% score
- Aging penalty: Loses 5% per week of age
- Maximum penalty: 25% (very old levels = 0% time score)
- Formula: max(0, 25 - (weeks_old × 5))
- Logic: Recent liquidity is more relevant than old liquidity that price has ignored for months
**Factor 3: Timeframe Alignment (25% weight)**
- Checks how many timeframes (1H, 4H, D1, W1) point in the same direction
- If multiple timeframes identify DOLs on the same side (all bullish or all bearish): Higher score
- If mixed signals: Lower score
- Formula: (aligned_timeframes / total_timeframes) × 25
- Logic: When multiple timeframes agree, the liquidity zone is validated across different time perspectives
**Total Confidence Score:**
```
Confidence = Cluster_Score + Time_Score + Alignment_Score
= (0-50%) + (0-25%) + (0-25%)
= 0-100%
```
**Example Calculation:**
```
DOL at 27,500:
- 6 out of 12 unmitigated levels cluster here → (6/12) × 50 = 25%
- Level is 2 weeks old → 25 - (2 × 5) = 15%
- 3 out of 4 timeframes bullish toward this level → (3/4) × 25 = 18.75%
- Total Confidence = 25% + 15% + 18.75% = 58.75% ≈ 59%
```
This mathematical approach removes subjectivity and provides objective, data-driven confidence scoring.
4. Multi-Timeframe Analysis
The indicator analyzes DOLs across four timeframes:
- **1H:** Intraday levels (fastest reaction)
- **4H:** Short-term swing levels
- **Daily:** Intermediate-term levels
- **Weekly:** Long-term structural levels
For each timeframe, it identifies:
- Highest confidence unmitigated high
- Highest confidence unmitigated low
- Directional bias (bullish if high > low confidence, bearish if low > high confidence)
5. Primary DOL Selection (AI Auto-Selection Logic)
When "Show AI DOL" is enabled, the indicator uses an automated selection algorithm to identify the most important targets:
**Step 1: Collect All Candidates**
The algorithm gathers all identified DOLs from all timeframes (1H, 4H, D1, W1) that meet minimum criteria:
- Must be unmitigated (not yet swept)
- Must have confidence score > 0%
- Must have at least 1 level in cluster
**Step 2: Calculate Confidence for Each**
Each candidate DOL receives its confidence score using the three-factor formula described above (Cluster + Time + Alignment).
**Step 3: Sort by Confidence**
All candidates are ranked from highest to lowest confidence score.
**Step 4: Select Primary and Secondary**
- **P1 (Primary DOL):** The DOL with the absolute highest confidence score
- **P2 (Secondary DOL):** The DOL with the second highest confidence score
**Why This Matters:**
Instead of manually scanning multiple timeframes and guessing which level is most important, the AI objectively identifies the two highest-probability liquidity targets based on quantifiable data.
**Example AI Selection:**
```
Available DOLs:
- 1H High: 27,400
- 4H High: 27,500
- D1 High: 27,500 ← P1 (Highest)
- W1 High: 27,650 ← P2 (Second Highest)
- 1H Low: 26,800
- D1 Low: 26,500
AI Selection:
P1 = 27,500 (Daily High with 92% confidence)
P2 = 27,650 (Weekly High with 88% confidence)
```
This provides a data-driven target selection rather than subjective manual interpretation. The AI removes emotion and bias, selecting targets based purely on mathematical probability.
Features
Why "AI" DOL?
The term "AI" in this indicator refers to the automated algorithmic selection process, not machine learning or neural networks. Specifically:
**What the AI Does:**
- Automatically evaluates all available DOLs across all timeframes
- Applies a weighted scoring algorithm (Cluster 50%, Time 25%, Alignment 25%)
- Objectively ranks DOLs by probability
- Selects the top 2 highest-confidence targets (P1 and P2)
- Removes human bias and emotion from target selection
**What the AI Does NOT Do:**
- It does not use machine learning or train on historical data
- It does not predict future price movements
- It does not adapt or "learn" over time
- It does not guarantee accuracy
The "AI" is simply an automated decision-making algorithm that applies consistent mathematical rules to identify the most statistically significant liquidity zones. Think of it as a "smart filter" rather than artificial intelligence in the traditional sense.
Visual Components
**Daily Level Lines:**
- Green lines: Unmitigated (not yet breached) levels
- Red lines: Mitigated (already breached) levels
- Dots at origin point showing where level was formed
- X marker when level gets breached
- Lines extend forward to show projection
**DOL Labels:**
- Display timeframe (1H, 4H, D1, W1) or "DOL" for AI selection
- Show confidence percentage in brackets
- Color-coded by timeframe:
- Lime: AI DOL (Smart selection)
- Aqua: 1-hour timeframe
- Blue: 4-hour timeframe
- Purple: Daily timeframe
- Orange: Weekly timeframe
**Info Box (Top Right):**
Displays comprehensive liquidity metrics:
- Total levels tracked
- Active (unmitigated) levels count
- Cleared (mitigated) levels count
- Flow direction (BID PRESSURE / OFFER PRESSURE)
- Most recent sweep
- Primary and Secondary DOL targets
- Multi-timeframe bias analysis
- Overall directional bias
Settings Explained
**Daily Levels Group:**
- Show Daily Highs/Lows: Toggle visibility of all daily level tracking
- Unbreached Color: Color for levels not yet hit
- Breached Color: Color for levels that have been swept
- Show X on Breach: Display marker when level is breached
- Show Dot at Origin: Display marker at level formation point
- Line Width: Thickness of level lines (1-5)
- Line Extension: How many bars forward to project (1-24)
- Max Days to Track: Historical lookback period (5-200 days)
**DOL Settings Group:**
- Cluster Tolerance %: Price range to group DOLs (0.1-2.0%)
- Show Price on Labels: Display actual price value on labels
- Backtest Mode: Only show recent labels for clean historical analysis
- Labels Lookback: Number of bars to show labels when backtesting (10-500)
**Info Box Group:**
- Show Info Box: Toggle info panel visibility
**DOL Toggles Group:**
- Show AI DOL: Display smart auto-selected primary target
- Show 1HR DOL: Display 1-hour timeframe DOLs
- Show 4HR DOL: Display 4-hour timeframe DOLs
- Show Daily DOL: Display daily timeframe DOLs
- Show Weekly DOL: Display weekly timeframe DOLs
**Advanced Group:**
- Manual Mode: Simplified display showing only daily high/low clusters
How to Use This Indicator
Educational Application
This indicator is intended for educational purposes to help traders:
1. **Understand Liquidity Concepts:** Visualize where unfilled orders may exist
2. **Identify Key Levels:** See where price may be drawn to
3. **Analyze Market Structure:** Understand how price interacts with liquidity
4. **Study Multi-Timeframe Alignment:** Observe when multiple timeframes agree
5. **Learn ICT Concepts:** Apply liquidity theory in practice
Interpretation Guidelines
**BID PRESSURE (Flow):**
When lows are being swept more than highs, it suggests:
- Sell-side liquidity being taken
- Potential for upward move to unfilled buy-side liquidity
- Market may be clearing the way for a bullish move
**OFFER PRESSURE (Flow):**
When highs are being swept more than lows, it suggests:
- Buy-side liquidity being taken
- Potential for downward move to unfilled sell-side liquidity
- Market may be clearing the way for a bearish move
**Confidence Scores:**
- 90-100%: Very high probability zone (strong cluster, recent, aligned)
- 80-89%: High probability zone (good cluster, relatively recent)
- 70-79%: Moderate probability zone (decent cluster or older)
- 60-69%: Lower probability zone (small cluster or very old)
- Below 60%: Weak zone (minimal confluence)
**Timeframe Analysis:**
- All timeframes LONG: Strong bullish alignment
- All timeframes SHORT: Strong bearish alignment
- Mixed: Conflicting signals, exercise caution
- Higher timeframes (D1, W1) carry more weight than lower (1H, 4H)
**DIRECTIONAL Indicator:**
- BULLISH: Overall bias suggests upward movement toward buy-side DOLs
- BEARISH: Overall bias suggests downward movement toward sell-side DOLs
- NEUTRAL: No clear directional bias, conflicting signals
Practical Application Examples
**Example 1: Bullish Setup**
```
Flow: BID PRESSURE (lows being swept)
P1: 27,500 (price above current market)
D1: LONG 27,500
W1: LONG 27,650
DIRECTIONAL: BULLISH
```
Interpretation: Price has cleared sell-side liquidity. High confidence buy-side DOL at 27,500. Daily and Weekly timeframes aligned bullish. Watch for move toward 27,500 target.
**Example 2: Bearish Setup**
```
Flow: OFFER PRESSURE (highs being swept)
P1: 26,200 (price below current market)
D1: SHORT 26,200
W1: SHORT 26,100
DIRECTIONAL: BEARISH
```
Interpretation: Price has cleared buy-side liquidity. High confidence sell-side DOL at 26,200. Daily and Weekly timeframes aligned bearish. Watch for move toward 26,200 target.
**Example 3: Mixed Signals - Wait**
```
Flow: BID PRESSURE
P1: 26,800
D1: LONG 27,000
W1: SHORT 26,200
DIRECTIONAL: NEUTRAL
```
Interpretation: Conflicting signals. Flow suggests up, but Weekly bias is down. Confidence scores moderate. Better to wait for clarity.
Important Considerations
This Indicator Does NOT:
- Predict the future
- Guarantee profitable trades
- Provide buy/sell signals
- Replace proper risk management
- Work in isolation without other analysis
This Indicator DOES:
- Visualize liquidity concepts
- Identify potential target zones
- Show timeframe alignment
- Calculate objective confidence scores
- Help understand market structure
Proper Usage:
1. Use as one component of a complete trading strategy
2. Combine with price action analysis
3. Confirm with other technical indicators
4. Consider fundamental factors
5. Always use proper risk management
6. Backtest any strategy before live trading
Risk Disclaimer
**FOR EDUCATIONAL PURPOSES ONLY**
This indicator is for educational purposes only. Trading financial markets involves substantial risk of loss. Past performance does not guarantee future results. Always conduct your own research and consult with a financial advisor before making trading decisions.
**Important Limitations:**
- No indicator is 100% accurate, including the AI selection
- The "AI" is an automated algorithm, not predictive artificial intelligence
- DOL levels can be swept and price can continue in the same direction
- Confidence scores are mathematical calculations, not predictions or probabilities of success
- High confidence does not mean guaranteed profit
- Markets can remain irrational longer than you can remain solvent
- Always use stop losses and proper position sizing
**Understanding the AI Component:**
The AI auto-selection feature uses a fixed mathematical formula to rank DOLs. It does not:
- Predict where price will go
- Learn from past performance
- Adapt to market conditions
- Guarantee any level of accuracy
The confidence score represents the mathematical strength of a liquidity cluster based on objective factors (cluster size, recency, timeframe alignment), NOT a probability of the trade succeeding.
**Risk Warning:**
Trading is risky. Most traders lose money. This indicator cannot change that fundamental reality. Use it as an educational tool to understand market structure, not as a trading signal or system.
Technical Requirements
- **Timeframe:** Best used on 1-hour charts (required for accurate daily level tracking)
- **Markets:** Works on any market (forex, crypto, stocks, futures, indices)
- **Updates:** Real-time calculation on each bar close
- **Resources:** Uses max 500 lines and 500 labels (TradingView limits)
Backtesting Features
The indicator includes "Backtest Mode" to keep historical charts clean:
- When enabled, only shows labels from recent bars
- Adjustable lookback period (10-500 bars)
- All lines remain visible
- Helps review past setups without clutter
To use:
1. Enable "Backtest Mode" in settings
2. Adjust "Labels Lookback" to desired period
3. Review historical price action
4. Disable for live trading
Credits and Methodology
This indicator implements concepts from:
- ICT (Inner Circle Trader) liquidity theory
- Smart Money Concepts (SMC)
- Order flow analysis
- Multi-timeframe analysis principles
The clustering algorithm, confidence scoring, and timeframe synthesis are original implementations designed to quantify and visualize these concepts.
Version History
**v1.0 - Initial Release**
- Multi-timeframe DOL detection
- Confidence scoring system
- Info box with liquidity metrics
- Backtest mode for clean charts
- Black/white professional theme
Support and Updates
For questions, feedback, or suggestions, please use the TradingView comments section. Updates and improvements will be released as needed based on user feedback and market evolution.
**Remember:** This is an educational tool. Successful trading requires knowledge, discipline, risk management, and continuous learning. Use this indicator to enhance your understanding of market structure and liquidity, not as a standalone trading system.

Volume Scope Pro - Order Flow Volume Analysis V1.01Volume Scope Pro — Order Flow Volume Analysis
Overview
Volume Scope Pro is a multi-faceted volume analysis indicator that separates volume into buy (up) and sell (down) components to reveal hidden order flow dynamics. It aggregates lower timeframe volume data to estimate buying vs. selling pressure on each bar, calculates the volume delta (buy volume minus sell volume) per bar, and highlights where price action diverges or converges with volume flow. The indicator provides visual output in the form of an on-chart table and chart markers, helping traders identify potential distribution (selling into strength) and absorption (buying into weakness) events, as well as support/resistance zones derived from volume extremes.
Volume Settings
• Global Volume Period – An integer (default 100) defining the shared lookback window (in bars) for all volume-based calculations. This period is used for identifying volume extrema and computing cumulative volume statistics. A larger period considers more history for averages and sums, while a smaller period focuses on recent bars.
• Use Custom Lower Timeframe – A boolean (default true) that lets you override the automatic choice of lower timeframe for volume breakdown. If enabled, the indicator will use the specific lower timeframe you provide (see next setting) to fetch intrabar volume data. If disabled, the script chooses a lower timeframe based on the chart’s resolution (for example, 1-second for second charts, 1-minute for other intraday charts, 5-minute for daily charts, etc.).
• Lower Timeframe – A timeframe input (default 15S, i.e. 15-second intervals) specifying the lower interval to request for up/down volume calculation. This is the resolution at which the script breaks each chart bar’s volume into buying vs. selling volume. Fifteen seconds is the default as it provides a fine-grained intrabar look on most charts. This setting only takes effect if Use Custom Lower Timeframe is true; otherwise, it is ignored in favor of the automatic timeframe resolution.
Table Display Settings
• A dropdown option that adjusts the text size used in the on-chart data table (Tiny, Small, Normal, Large, Huge; default: Tiny). The default Tiny setting is selected because many traders use the indicator on mobile devices where screen space is limited. If you are using a larger display such as a laptop, desktop, or tablet, you may increase the font size to your preference for improved readability.
• Table Font Color – A color picker for the table text (default is a shade of blue, #0068e6). All text in the table will be rendered in this color. You can change it to improve contrast against your chart background or personal preference.
• Time Offset (hours) – An integer offset in hours (default 3) applied to the current time display in the table. This shifts the real-time clock readout from UTC by the specified number of hours in the table’s header. For example, setting 0 uses UTC, while a value of 3 (default) shows local time for UTC+3. Negative values are allowed for time zones behind UTC. This does not affect any calculations – it only adjusts the displayed clock for user convenience.
Trend Line & Pivot Settings
• Pivot Left and Pivot Right – Integers (default 5 each) controlling the sensitivity of pivot high/low detection. A pivot high is identified when the price high of a bar is greater than the highs of the Pivot Left bars to its left and Pivot Right bars to its right. Similarly, a pivot low is a bar whose low is lower than the lows of the surrounding bars on its left and right as defined by these values. Smaller values make the pivots more local and frequent, while larger values require more significant swings.
• Pivot Count – An integer (default 5) specifying the number of recent pivot points to track. The indicator will remember up to this many pivot highs and pivot lows each, and use them for drawing trend lines. When the count is exceeded, the oldest pivot points are dropped to focus on the most recent ones.
• Lookback Length – An integer (default 100) defining the number of bars over which trend lines are extended and within which pivot points are considered relevant. Essentially, this is the length of the window (in bars) in which the detected pivots and their connecting trend lines will be shown. Trend lines will start at the beginning of this lookback window and end at the latest bar, updating as new bars form.
• High Trend Line Color / Low Trend Line Color – Color inputs for the drawn trend lines connecting pivot highs and pivot lows, respectively (both default to orange #ff7b00). High trend lines typically slope downwards (connecting recent highs), and low trend lines slope upwards (connecting recent lows). You can change these colors to visually distinguish the two or to fit your chart theme.
• Trend Line Thickness – An integer (default 2) setting the stroke width of the pivot trend lines. Higher values make the lines thicker and more prominent.
• Trend Line Style – A string option (default dashed, options: solid, dashed, dotted) determining the line style for both high and low trend lines. For example, choosing “dotted” will draw the trend lines as a series of dots. This purely affects the appearance and has no impact on calculations.
Support/Resistance (S/R) Zone Settings
• SR Lookback Length – An integer (default 100) that defines how many completed bars are scanned for support/resistance zone detection based on volume extrema. The indicator examines this many bars behind the latest bar (the current bar is excluded to avoid repaint issues) to find extreme buying and selling volume points that form the zones. A larger value means a longer historical window for finding significant volume-based zones.
• Projection Bars – An integer (default 26, range 0–200) specifying how far into the future to extend the S/R zone lines. When set above 0, the horizontal lines marking the zones will project to the right of the latest bar by the given number of bars. This helps anticipate where the zones lie ahead of current price. A value of 0 confines the zone markings to past bars only.
• Resistance Zone Color / Support Zone Color – Color inputs for the drawn zones identified as resistance and support (defaults are red for resistance and teal for support). These colors apply to both the zone’s border lines and its background fill (with adjustable transparency, see below).
• Resistance Line Width / Support Line Width – Integers (default 2 each, range 1–5) setting the line thickness for the top and bottom boundaries of the resistance zone and support zone, respectively. For example, if Resistance Line Width is 3, the drawn lines at the top and bottom of the resistance zone will be thicker than the default.
• Resistance Fill Transparency / Support Fill Transparency – Integers in percentage (default 90 each, range 0–100) controlling the opacity of the colored shading that fills the zone area. 0% means fully opaque (solid color fill), and 100% means fully transparent (no fill color). The default of 90% is very transparent, just lightly coloring the zone area for subtlety. Adjust these to highlight the zones more prominently or to make them nearly invisible, depending on preference.
Overbought/Oversold (OB/OS) Voting Settings
• Enable OB/OS Voting – A boolean (default true) that turns on the overbought/oversold “voting” module. When enabled, the indicator evaluates standard technical indicators (RSI, Stochastic, CCI, etc.) to determine if the market is overbought (OB) or oversold (OS). Each indicator contributes an OB or OS “vote” based on its classic threshold (for example, RSI > 70 is an OB vote, RSI < 30 is OS). The module aggregates these votes to identify consensus extreme conditions.
• Enable Volume Confirmation Filter – A boolean (default true) that requires volume confirmation for OB/OS signals. If enabled, an overbought condition will only be confirmed if there is unusually high sell volume at the same time, and an oversold condition will only confirm with unusually high buy volume. In practice, this means even if indicators vote OB/OS, the script will only mark it as confirmed when volume is spiking in the opposite direction of price (signaling distribution for OB or absorption for OS). This filter helps ensure that OB/OS signals align with significant volume imbalance, indicating potential involvement of larger market participants.
• Enable Dynamic ATR Threshold – A boolean (default true) that adjusts the overbought/oversold trigger threshold dynamically based on volatility (ATR). When true, the voting threshold or confirmation conditions may be eased or tightened depending on recent volatility, as measured by the Average True Range. In higher volatility environments, this can prevent premature OB/OS signals by requiring more extreme indicator readings.
• Enable OB/OS Sync Window – A boolean (default true) that allows an OB or OS condition to remain valid for a short window of bars. If enabled, once an OB or OS state is triggered, it can persist for a user-defined number of bars (see Bars for Hit Sync Window) even if not all indicators remain in agreement every single bar. This helps to capture a cluster of OB/OS signals as one event rather than flickering on and off.
• Volume Average Period – An integer (default 3) specifying how many recent bars of volume to average when determining “unusually high” volume for confirmation. The script calculates the average buy volume and sell volume over this many bars; then the Volume Spike Ratio inputs (below) are applied to decide if current volume is significantly above average. For example, with a period of 3, the buy/sell volume of the last 3 bars are averaged to use as a baseline.
• Minimum Vote Count for OB/OS – An integer (default 3) setting the minimum number of indicators that must agree on overbought or oversold to consider it a valid signal. If fewer than this number signal OB (or OS) at the same time, the condition is ignored. A higher threshold makes the OB/OS signal rarer but more robust (requiring broader agreement among indicators).
• Bars for Hit Sync Window – An integer (default 1) controlling the size of the synchronization window (mentioned above) in bars. If an OB/OS condition is identified, it remains “active” for this many subsequent bars, allowing slightly delayed volume confirmation or indicator agreement to still count as part of the same event. For example, with a value of 2, if an OB signal occurs on one bar and the volume spike confirmation happens on the next bar, the module will treat it as a continuous event and still flag it.
• ATR Adjustment Factor – A float (default 14, step 1.0) used when Dynamic ATR Threshold is enabled. This factor influences how much ATR-based volatility adjustment is applied to the OB/OS vote threshold or confirmation criteria. A larger number might increase tolerance in volatile conditions. (Note: 14 here likely corresponds to an ATR period internally, not a direct multiplier of ATR value. It effectively adjusts sensitivity but does not need frequent change.)
• Overbought: Sell Volume Spike Ratio – A float (default 1.5) that sets the multiple of average sell volume required to confirm an Overbought condition. If the current sell volume is at least this factor times the recent average sell volume (over the Volume Average Period), and indicators are signaling OB, then an Overbought state is confirmed. For instance, the default 1.5 means sell volume must be 150% or more of its average to validate an OB signal. This ensures that an overbought label is only shown when there’s evidence of heavy selling (distribution) accompanying the price being overbought.
• Oversold: Buy Volume Spike Ratio – A float (default 2.0) setting the multiple of average buy volume required to confirm an Oversold condition. With the default 2.0, the current buy volume needs to be at least 200% of its recent average for an OS signal to confirm. This indicates strong buying interest (absorption) when price is in an oversold state. Typically, oversold conditions with significant buy volume could precede upward reversals.
• Source – A price source input (default close) for OB/OS calculations. This is the series value passed into the 20 indicator calculations (RSI, Stoch, etc.). By default it uses closing price, but advanced users can change it (for example, to an HLC3 or other composite) if desired. Generally, leaving it as close is standard.
Indicator Calculations and Logic
Volume Data Aggregation and Delta Calculation
At the core of Volume Scope Pro is the separation of total volume into up-volume (buying) and down-volume (selling) on each bar. This is achieved by requesting lower timeframe data using TradingView’s built-in requestUpAndDownVolume() function. Specifically, for each chart bar, the script gathers volume from a lower timeframe interval (e.g., 15-second bars) that fits within the higher timeframe bar. It sums the volume of all lower-TF sub-bars where price moved up (buy volume) vs. down (sell volume), providing an estimate of how much of the volume was transacted at the ask (buys) versus at the bid (sells). The resulting values are stored as upVolume and downVolume for the current bar, and the volume delta is computed as deltaVolume = upVolume – downVolume. By default, the script ensures upVolume and downVolume are treated as absolute magnitudes, while deltaVolume can be positive or negative indicating net buy or sell dominance.
If Use Custom Lower Timeframe is disabled, the indicator automatically chooses an appropriate lower timeframe based on the chart’s resolution. This adaptive logic uses 1-second intervals for charts in seconds, 1-minute for intraday minutes, 5-minute for daily charts, and 60-minute for anything higher, ensuring that up/down volume can be computed across various chart periods. If even finer resolution is needed or the user prefers a specific timeframe (e.g., 15S), enabling the custom option allows that override.
Coverage:
Because not all historical bars will have lower timeframe data available (especially if looking far back or on certain assets/timeframes), the script tracks how many bars actually received a valid up/down volume calculation. Each bar with non-na deltaVolume is counted toward a coverage total . This coverage count is displayed in the table (as “Coverage: X Bars”) to inform the user how many bars in the dataset had full volume breakdown data. It also serves a technical purpose: certain moving averages or calculations are “gated” to only output values when enough data points exist. For example, a 20-bar average of buy volume will not be shown until at least 20 bars with volume data are present; until then it returns NA to avoid misleading results. This gating mechanism is implemented via helper functions that check coverage before computing moving averages or sums. In practice, if you apply the indicator to a fresh chart or after changing the lower timeframe setting, you may see “NA” placeholders for some values until sufficient bars accumulate.
Volume Averages and Recent Change Indicators
For both buy and sell volume, the script computes short-term and medium-term averages to contextualize the current bar’s activity. Specifically, it calculates a 3-bar simple moving average and a 20-bar simple moving average of upVolume and downVolume (these lengths are fixed and chosen to represent a fast vs. slow window). These averages are shown in the table to compare against the current volume:
• The “Buy Current Amount” is the current bar’s buy volume, shown in an engineered format (e.g., 1.25K for 1,250) for readability. Directly below it (in the same cell via a newline) is “Avg : (3 | 20)”, which lists the 3-bar average buy volume and 20-bar average buy volume. Each average value is followed by an arrow marker:
an upward arrow 🔼 means the current buy volume is higher than that average, whereas a downward arrow 🔻 means the current buy volume is lower than that average. These markers give a quick visual cue – for instance, a 🔼 next to the (3) average indicates a volume spike in the very short term (current bar’s buy volume exceeds the recent 3-bar norm). If not enough data exists to compute an average, “NA” is displayed with the window in parentheses (e.g., “NA (20)” if fewer than 20 bars of coverage). The same format is used for Sell volume, where “Sell Current Amount” is the current bar’s sell volume with its own 3-bar and 20-bar averages and markers.
In addition to the short/medium term averages, the script also computes a “global” average buy volume and sell volume over the full Global Volume Period (using a slightly different approach). It first finds the proportion of buy vs sell over that window (summing all upVolume and downVolume over L = Global Volume Period bars) and then multiplies that ratio by the average total volume on the chart timeframe. This yields an implied average buy volume and sell volume for the global window (taking into account that the chart’s own volume may differ from summed LTF volume due to how the LTF data is sampled). These global averages are used internally (for example, in the OB/OS volume filter logic) but are not explicitly printed in the table. Instead, the table provides a more direct insight: the Positive Δ Sum and Negative Δ Sum (explained later) show accumulated buying vs selling pressure over the lookback period.
Price and Volume Trend Convergence/Divergence
Volume Scope Pro analyzes the short-term and medium-term trends of price and volume to identify convergence or divergence between price movement and buy/sell activity. This is done by calculating the angle of linear regression (slope in degrees) for price and for volume over the same two windows (3 bars and 20 bars). In essence, it fits a line through the last 3 closes and measures its angle, and similarly fits lines through the last 3 buy-volume values, last 3 sell-volume values, and repeats for 20 bars. The angles for price vs. volume are then compared:
• For the buy side, the indicator computes the price angle (θ) over 3 bars and 20 bars, and the buy-volume angle over 3 and 20 bars. These are displayed in the table under a “Buy Volume Trend” row. For example, it might show: “Price θ: 12.5° (3) | 5.0° (20)” on one line and “BuyVol θ: 8.0° (3) | 2.0° (20)” on the next. Each angle is given in degrees (θ symbol) with one decimal precision. A positive angle means an uptrend (price or volume increasing), and a negative angle means a downtrend over that window.
• After listing the angles, a convergence/divergence label is shown for each window: either Convergent or Divergent for the 3-bar window and similarly for the 20-bar window. This indicates whether price and buy volume are moving in the same direction (convergent) or opposite directions (divergent). For instance, if price’s 3-bar trend is up (positive slope) but buy-volume’s 3-bar trend is down (negative slope), that would be Divergent (3), signaling a short-term anomaly (price rising on falling buy volume). Conversely, if both price and buy volume are rising together over 20 bars, that shows Convergent (20), indicating buy volume is supporting the uptrend. These convergence/divergence labels help identify potential early warning signs: divergence may precede a reversal or indicate that an observed price move lacks volume support.
The same analysis is done for the sell side. The table’s “Sell Volume Trend” row lists “Price θ: ... | ...” and “SellVol θ: ... | ...” for 3 and 20 bars , followed by labels showing whether price vs. sell volume trends are convergent or divergent over those periods. For example, if price is trending down (negative angle) while sell volume is also trending down, they are Convergent (both indicating selling pressure in line with price drop). If price is falling but sell volume trend is up, that’s Divergent – price decrease accompanied by increasing sell volume could indicate aggressive selling (potential capitulation or acceleration of downtrend). On the other hand, price falling with decreasing sell volume might suggest selling is drying up (potential for a bottom). These nuances can be gleaned from the convergence/divergence outputs.
All angle calculations use a normalized linear regression slope converted to degrees for easy interpretation. The use of a short (3) and longer (20) window provides a quick glance at immediate vs. recent trend alignment. In the table, the angles and convergence labels are organized in two lines for buy and two lines for sell to clearly separate the information.
Volume Delta and Cumulative Delta Sums
The Volume Delta (Δ) for the current bar is a key metric showing the net difference between buy and sell volume. In the table, it appears as a single-line entry like “Delta: 5.2K” (for example) in the volume delta row. The value is formatted with K/M/B suffix if large, and it is colored green if positive (indicating net buying pressure) or red if negative (net selling pressure), with a neutral color if essentially zero. This coloring provides instant visual feedback: a green Delta means buyers dominated that bar, whereas a red Delta means sellers dominated. The delta number itself helps gauge the magnitude of that dominance. For instance, “Delta: 1.5M” in green would signify a very large imbalance of buying volume on that bar. This row gives a per-bar order flow insight complementing the price action of the candle.
To assess the broader context, the indicator also computes cumulative delta sums over the Global Volume Period. It separately accumulates all positive delta values and all negative delta values within the lookback window (e.g., 100 bars). The results are shown in the table as two lines: Positive Δ Sum and Negative Δ Sum, each followed by a number. These represent the total volume imbalance accumulated in each direction over the window. For example, a Positive Δ Sum of 20K means that, summing all bars in the window where buy > sell volume, buyers were ahead by a total of 20,000 volume (volume units) in that period. Similarly, a Negative Δ Sum of 15K would mean sellers were ahead by 15,000 volume in other bars. These sums give a sense of who is in control over the recent horizon: if Positive Δ Sum greatly exceeds Negative Δ Sum, the market has seen net accumulation (buying) in the lookback; if the reverse, net distribution (selling). The values are shown in a neutral text color (since they are not inherently “good” or “bad”) and are formatted with K/M suffixes as needed. They can help confirm trends or identify subtle shifts – for instance, if price is flat but Positive Δ Sum is growing rapidly, it might indicate stealth accumulation even without price movement.
Support/Resistance Zone Detection from Volume Extremes
Volume Scope Pro identifies key support and resistance areas by analyzing how volume behaved in recent price movements. Zones are derived from points where buying or selling activity became unusually strong or unusually weak—areas that often act as reaction levels in future price action.
A high-activity region is highlighted as a Resistance Zone, showing where strong participation previously slowed upward movement.
A low-activity region forms a Support Zone, indicating price levels where the market tended to stabilize or absorb pressure.
These zones are displayed as horizontal regions projected forward on the chart, with customizable colors and styling. Their upper and lower boundaries are shown in the on-chart table, where the indicator also notes whether each zone currently acts as support or resistance based on price position.
🟥 Resistance Zone based on
Buy/Sell Amount: 1.2345 ~ 1.2500
This indicates a resistance zone between roughly 1.2345 and 1.2500 (the bottom and top of that zone). “Buy/Sell Amount” here refers to the fact that this zone was computed from extreme buy/sell volume events, and the values are the zone’s price range. Likewise, a support zone line would be prefixed with 🟩 and show its range. These zones give a unique volume-based perspective on support and resistance, complementing traditional price-based levels.
Pivot-Based Trend Lines
The indicator draws adaptive trendlines by tracking recent swing highs and swing lows. Whenever the market forms meaningful pivots, the tool connects these points to outline the active upward and downward trend structure. A line drawn through recent highs generally acts as a dynamic resistance guide, while a line drawn through lows often behaves as a rising support boundary.
As market structure evolves, the trendlines update automatically, keeping the analysis aligned with the most recent swings. The color, thickness, and style of these lines are fully customizable. At any moment, you may see one line tracking the upper structure and one line tracking the lower structure, helping identify potential breakout areas or trend-channel behavior without manual drawing.
Overbought/Oversold Voting and Volume Signals
Volume Scope Pro includes an Overbought/Oversold engine that evaluates market exhaustion by combining technical momentum signals with real volume behavior. Instead of relying on a single indicator, the system draws from a broad set of classical oscillators, creating a multi-layer confirmation approach.
The tool aggregates signals from a group of well-known indicators and identifies when several of them simultaneously reach extreme levels. When enough of these indicators align, the condition is considered overbought or oversold. To refine these readings, an optional volume filter checks whether buying or selling pressure is unusually strong at the same time.
• Overbought (OB) is highlighted only when technical exhaustion coincides with elevated sell volume.
• Oversold (OS) appears when oversold readings align with strong buy volume.
When confirmed, the indicator places clear visual markers on the chart:
• OB – potential topping conditions supported by heavy selling.
• OS – potential bottoming conditions supported by strong buying.
• Distribution (↑P ↑S) – price rising while selling pressure increases.
• Absorption (↓P ↑B) – price falling while buyers absorb the move.
• Combined signals (OB+DIST or OS+ABS) highlight the strongest forms of exhaustion.
These markings help traders quickly recognize areas where momentum is fading and volume behavior becomes important. While they do not predict exact turning points, they often appear during phases where the market prepares for a shift, consolidation, or slowing trend.
Usage Notes and Interpretation
Volume Scope Pro provides a detailed view into the internal dynamics of market volume, which can greatly aid analysis when used appropriately. Here are some important considerations and best practices:
• Data Availability (Coverage): The accuracy and utility of this indicator depend on the availability of lower timeframe data for the instrument. On very high timeframe charts (weekly/monthly) or illiquid symbols, the automatic lower timeframe (like 1 minute or 5 minutes) might not retrieve full historical intrabar data, resulting in limited coverage. This is indicated in the “Coverage: X Bars” readout. If coverage is low, many of the volume-based values (especially 20-bar averages or global sums) may show “NA” or be unrepresentative until more data accumulates. It’s often best to use this indicator on active symbols and reasonable timeframes (e.g., 1h, 4h, 1D with a few months of data or lower) to ensure plenty of sub-bar data is available. If needed, you can reduce the Global Volume Period to focus on a smaller window that has full coverage, or experiment with a different Lower Timeframe that might have more data available (for example, using 1min instead of 15s on very long histories).
• Interpreting Volume Delta and Trends: A key value to watch is the Delta (Δ) and how it changes. For instance, if price is making new highs but Δ is decreasing or negative, it indicates bearish divergence – fewer buyers are supporting the move, or sellers might be increasingly active (distribution). Conversely, price making new lows while Δ becomes less negative or turns positive is a bullish divergence, implying sellers are exhausting and buyers are stepping in (absorption). The convergence/divergence rows quantitatively highlight these situations. Use them as alerts to investigate further rather than automatic trade signals. For example, a divergent 20-bar trend (price up, buy volume down) doesn’t mean price will immediately reverse, but it does warrant caution as the rally may be on weak footing.
• Support/Resistance Zones: The volume-derived S/R zones offer levels that might not be obvious from price alone. They often pinpoint areas where the tug-of-war between buyers and sellers was most extreme (resistance zone) or where the market had a lull in volume (support zone). Treat these zones as you would conventional support/resistance: price may react when revisiting them. A common use is to watch how price behaves upon approaching a highlighted zone – for instance, if price rallies into a red resistance zone and you see volume delta start to flip negative, it could strengthen the case that the zone is indeed acting as resistance due to renewed selling. The zones update once a new volume extreme enters or exits the lookback window, so they are relatively static during most recent price action, shifting only when a significantly larger volume spike happens or the oldest bar in the window moves out. They are also non-repainting for completed bars (the algorithm excludes the current bar for zone calculation to avoid repaint issues). Keep in mind these zones are horizontal areas; they do not guarantee a reversal, but they mark where supply or demand was notably strong in the past, which is useful context.
• Trend Lines and Pivots: The automatic trend lines drawn from pivot highs and lows can help visualize short-term price channels or triangles. They update in real-time as new pivots form. Use them as guidance for potential breakout or breakdown levels – e.g., if price breaks above a descending high line, that could indicate a bullish breakout from the recent down trend. The pivot detection sensitivity (Pivot Left/Right) can be tuned: higher values will only draw lines across more significant swings, whereas lower values will catch minor swings too. Adjust according to the volatility of the asset (more volatile assets might need larger pivot settings to filter noise). The trend lines are an auxiliary feature in this volume tool, meant to save time drawing those lines manually for recent swings. They work best when recent pivots are clear; in choppy conditions with many equal highs/lows, you might see the lines adjust frequently.
• OB/OS Voting Signals: The overbought/oversold markers (OB, OS, distribution, absorption) are perhaps the most actionable signals from this script, but they should not be used in isolation. They effectively combine momentum and volume analysis. A prudent approach is to confirm these signals with price action or other analysis:
• An “OB” (Overbought) marker suggests a probable short opportunity or at least to be cautious with longs. When you see OB, check if it aligns with other factors: Is price at a known resistance or a volume zone? Is there a bearish candlestick pattern? Multiple OB signals in a cluster (with or without “DIST”) could indicate a topping process – you might wait for price to start rolling over before acting.
• An “OS” (Oversold) marker points to a potential long opportunity or caution with shorts. Look for confluence such as the price being at a support zone, a bullish divergence in delta, or a reversal candle. Sometimes one OS by itself might just lead to a small bounce in an ongoing downtrend, but a series of OS/ABS signals could mark a accumulation phase.
• Distribution (↑P↑S) and Absorption (↓P↑B) markers can appear even without full OB/OS votes. These warn of stealthy behavior: e.g., Distribution triangles showing up during a steady uptrend might precede larger profit-taking drops. Absorption triangles in a downtrend might precede a relief rally. They are early warnings – pay attention if they start to cluster or coincide with known S/R levels.
• The combined labels OB+DIST and OS+ABS are stronger alerts since they mean both the indicators and volume are screaming extreme. These are relatively rarer; when they appear, the likelihood of at least a short-term reversal is higher. Still, disciplined risk management is essential as markets can remain overbought/oversold longer than expected.
• No Guarantees & Context: It’s important to emphasize that none of these outputs guarantee a price will move in a certain direction. They highlight conditions that historically often precede moves. Volume Scope Pro should be used as an informational tool to augment your analysis. For example, you might use it to confirm a breakout (volume delta turning strongly positive on a price break) or to spot divergence (price making a new high but Δ Sum not increasing). Always consider the broader context: trend direction, higher timeframe signals, fundamental news, etc. A bullish signal in a strong downtrend may only yield a minor correction, and a bearish signal in a roaring uptrend might just be a pause.
• Avoiding Over-Optimization: The indicator comes with many inputs. It might be tempting to tweak them frequently, but it’s recommended to start with defaults and adjust only if you understand the effect. For instance, if you increase Minimum Vote Count for OB/OS, you’ll get fewer but more conservative signals – you might miss early warnings. Changing Volume Spike Ratios alters how sensitive the volume filter is – lower ratios give more signals (even on modest volume rises) but risk false alarms. Use these settings to tailor the indicator to the asset or timeframe (e.g., a very high-volume asset might justify a higher spike ratio). The defaults have been chosen to suit a wide range of scenarios reasonably well.
• Performance and Chart Load: Volume Scope Pro does heavy processing by requesting a lower timeframe and calculating many values. On some platforms, loading this indicator might be slightly slower or consume more memory. It’s invite-only and not open-source, which means the calculations happen behind the scenes. If you experience any slowness, you can try using a less granular lower timeframe (e.g., 1min instead of 15s) or reduce the Global Volume Period to lighten the load. Generally it runs efficiently, but be mindful if stacking it with many other complex indicators.
In summary, Volume Scope Pro provides a set of volume-centric insights: from basic buy/sell volume split and delta, to trend alignment, to volume-profile S/R levels, to multi-indicator OB/OS warnings with volume validation. It adheres strictly to providing factual, data-driven information with no predictive guarantees. Traders can utilize this tool to observe where large buyers or sellers might be operating (“smart money”), detect when volume behavior contradicts price (a sign of potential reversals), and identify hidden support and resistance zones. All these pieces of information, when combined with sound strategy and risk management, can improve decision-making. Always remember to use this indicator as one part of a comprehensive analysis.

Pressure Pivots - MPIPressure Pivots - MPI
A multi-factor reversal detection system built on a proprietary Market Pressure Index (MPI) that combines institutional order flow analysis, liquidity dynamics, and momentum exhaustion to identify high-probability pivot points with automated win rate validation.
What This System Does
This indicator solves the core challenge of reversal trading: distinguishing genuine exhaustion pivots from temporary retracements. It combines six independent detection mechanisms—divergence, liquidity sweeps, order flow imbalance, wick rejection, volume surges, and velocity exhaustion—weighted by reliability and unified through a custom pressure oscillator.
Three-Layer Architecture:
Layer 1 - Market Pressure Index (MPI): Proprietary volume-weighted pressure oscillator that measures buying vs. selling pressure using proportional intrabar allocation and dual-timeframe normalization (-1.0 to +1.0 range).
Layer 2 - Weighted Confluence Engine: Six detection factors scored hierarchically (divergence: 3.0 pts, liquidity: 2.5 pts, order flow: 2.0 pts, velocity: 1.5 pts, wick: 1.5 pts, volume: 1.0 pt). Premium signals (DIV/LIQ/OF) require 6.0+ score, standard signals (STD) require 4.0+ score.
Layer 3 - Automated Win Rate Validation: Every signal tracked forward and validated against actual pivot formation within 10-bar window. Real-time performance statistics displayed by signal type and direction.
The Market Pressure Index - Original Calculation
What MPI Measures: The balance of aggressive buying vs. aggressive selling within each bar, smoothed and normalized to create a continuous oscillator.
Calculation Methodology:
Step 1: Intrabar Pressure Decomposition
Buy Pressure = Volume × (Close - Low) / (High - Low)
Sell Pressure = Volume × (High - Close) / (High - Low)
Net Pressure = Buy Pressure - Sell Pressure
Step 2: Exponential Smoothing
Smooth Pressure = EMA(Net Pressure, 14)
Step 3: Normalization
Avg Absolute Pressure = SMA(|Net Pressure|, 28)
MPI Raw = Smooth Pressure / Avg Absolute Pressure
Step 4: Sensitivity Amplification
MPI = clamp(MPI Raw × 1.5, -1.0, +1.0)
Why This Is Different:
• vs. RSI: RSI measures price momentum without volume context. MPI integrates volume magnitude and distribution within each bar.
• vs. OBV: OBV uses binary classification (up bar = buy volume). MPI uses proportional allocation based on close position within range.
• vs. Money Flow Index: MFI uses typical price × volume. MPI uses intrabar positioning, revealing pressure balance regardless of bar-to-bar movement.
• vs. VWAP: VWAP shows average price. MPI shows directional pressure balance (who controls the bar).
MPI Interpretation:
• +0.7 to +1.0: Extreme buying pressure (strong uptrends, potential exhaustion)
• +0.3 to +0.7: Moderate buying pressure (healthy uptrends)
• -0.3 to +0.3: Neutral/balanced (ranging, consolidation)
• -0.7 to -0.3: Moderate selling pressure (healthy downtrends)
• -1.0 to -0.7: Extreme selling pressure (strong downtrends, potential exhaustion)
Critical Insight: MPI at extremes indicates pressure exhaustion risk , not automatic reversal. Reversals occur when extreme MPI coincides with confluence factors.
Six Confluence Factors - Detection Arsenal
1. Divergence Detection (Weight: 3.0 - Highest Priority)
Detects: Price making higher highs while MPI makes lower highs (bearish), or price making lower lows while MPI makes higher lows (bullish).
Why It Matters: Reveals weakening pressure behind price moves. Declining participation signals potential reversal.
Signal Type: Premium (DIV) - Historically highest win rates.
2. Liquidity Sweep Detection (Weight: 2.5)
Detects: Price penetrates recent swing high/low (triggering stops), then immediately reverses and closes back inside range.
Calculation: High breaks swing high by <0.3× ATR but closes below it (bearish), or low breaks swing low by <0.3× ATR but closes above it (bullish).
Why It Matters: Stop hunts mark institutional accumulation/distribution zones. Often pinpoints exact pivot points.
Signal Type: Premium (LIQ) - Extremely reliable with volume confirmation.
3. Order Flow Imbalance (Weight: 2.0)
Detects: Aggressive directional ordering where price consistently closes in upper/lower third of bars with elevated volume.
Calculation:
Close Position = (Close - Low) / (High - Low)
Aggressive Buy = Volume when Close Position > 0.65
Aggressive Sell = Volume when Close Position < 0.35
Imbalance = EMA(Aggressive Buy, 5) - EMA(Aggressive Sell, 5)
Strong Flow = |Imbalance| > 1.5 × Average
Why It Matters: Reveals institutional accumulation/distribution footprints before directional moves.
Signal Type: Premium (OF)
4. Wick Rejection Patterns (Weight: 1.5)
Detects: Pin bars, hammers, shooting stars where wick exceeds 60% of total bar range.
Why It Matters: Large wicks demonstrate failed attempts to push price, indicating strong opposition.
5. Volume Spike Detection (Weight: 1.0)
Detects: Volume exceeding 2× the 20-bar average.
Why It Matters: Confirms institutional participation vs. retail noise. Most effective when combined with wick rejection or liquidity sweeps.
6. Velocity Exhaustion (Weight: 1.5)
Detects: Parabolic moves (velocity >2.0× ATR over 3 bars) showing deceleration while MPI at extremes.
Calculation:
Velocity = Change(Close, 3) / ATR(14)
Exhaustion = |Velocity| > 2.0 AND MPI > |0.5| AND Velocity Slowing
Why It Matters: Extended moves are unsustainable. Momentum deceleration from extremes precedes reversals.
Signal Classification & Scoring
Weighted Confluence Scoring:
Each factor contributes points when present. Signals fire when total score exceeds thresholds:
Bearish Example:
+ At recent high (1.0)
+ Bearish divergence (3.0)
+ Wick rejection (1.5)
+ Volume spike (1.0)
+ Velocity slowing (1.5)
= 8.0 total score → BEARISH DIV SIGNAL
Bullish Example:
+ At recent low (1.0)
+ Liquidity sweep (2.5)
+ Strong buy flow (2.0)
+ Wick rejection (1.5)
= 7.0 total score → BULLISH LIQ SIGNAL
Dual Threshold System:
• Premium Signals (DIV/LIQ/OF): Require 6.0+ points. Must include divergence, liquidity sweep, or order flow. Higher win rates.
• Standard Signals (STD): Require 4.0+ points. No premium factors. More frequent, moderate win rates.
Visual Signal Color-Coding:
• Purple Triangle: DIV (Divergence signal)
• Orange Triangle: LIQ (Liquidity sweep signal)
• Aqua Triangle: OF (Order flow signal)
• Red/Green Triangle: STD (Standard signal)
• Yellow Diamond: Warning (setup forming, not confirmed)
Warning System - Early Alerts
Yellow diamond warnings fire when 2+ factors present but full confluence not met:
• At recent 10-bar high/low
• Wick rejection present
• Volume spike present
• MPI extreme or accelerating/decelerating
Critical: Warnings are NOT trade signals. They indicate potential setups forming. Wait for colored triangle confirmation.
Win Rate Validation - Transparent Performance Tracking
How It Works:
Signal Storage: Every signal recorded (bar index, price, type, direction)
Pivot Confirmation: System monitors next 10 bars for confirmed pivot formation at signal price (±2%)
Validation: If pivot forms within window → Win. If not → Loss.
Statistics: Win Rate = Validated Signals / Total Mature Signals × 100
Dashboard Displays:
• Overall win rate with visual bar
• Bearish signal win rate
• Bullish signal win rate
• Win rate by signal type (DIV/LIQ/OF/STD)
• Wins/Total for each category
Why This Matters:
After 30-50 signals, you'll know exactly which patterns work on your instrument:
Example Performance Analysis:
Overall: 58% (35/60)
Bearish: 52% | Bullish: 65%
DIV: 72% | LIQ: 68% | OF: 50% | STD: 38%
Insight: Focus on bullish DIV/LIQ signals (72%/68% win rate), avoid STD signals (38%), investigate bearish underperformance.
This transforms the indicator from signal generator to learning system.
Dynamic Microstructure Visualization
Fibonacci Retracement Levels
• Auto-detects last swing high + swing low
• Draws 11 levels: 0%, 23.6%, 38.2%, 50%, 61.8%, 78.6%, 100%, 127.2%, 161.8%, 200%, 261.8%
• Removes crossed levels automatically
• Clears on new signal (fresh structure analysis)
• Color gradient (bullish to bearish across range)
• Key levels (0.618, 0.5, 1.0) highlighted with solid lines
Support/Resistance Lines
• Resistance: 50-bar highest high (red, only shown when above price)
• Support: 50-bar lowest low (green, only shown when below price)
• Auto-removes when price crosses
Usage: Signals firing at key Fibonacci levels (38.2%, 50%, 61.8%) or major S/R zones have enhanced structural significance.
Dashboard - Real-Time Intelligence
MPI Status:
• Current pressure reading with interpretation
• Color-coded background (green/red/gray zones)
Signal Status:
• Active signal type and direction
• Confidence score with visual bar (20 blocks, color-coded)
• Scanning status when no signal active
Divergence Indicator:
• Highlights active divergence separately (highest priority factor)
Performance Stats:
• Overall win rate with 10-block visual bar
• Directional breakdown (bearish vs. bullish)
• Signal type breakdown (DIV/LIQ/OF/STD individual win rates)
• Sample size for each category
Customization:
• Position: 9 locations (Top/Middle/Bottom × Left/Center/Right)
• Size: Tiny/Small/Normal/Large
• Toggle sections independently
How to Use This System
Initial Setup (10 Minutes)
1. MPI Configuration:
• Period: 14 (balanced) | 5-10 for scalping | 21-30 for swing
• Sensitivity: 1.5 (moderate) | Increase if MPI rarely hits ±0.7 | Decrease if constantly maxed
2. Detection Thresholds:
• Wick Threshold: 0.6 (60% of bar must be wick)
• Volume Spike: 2.0× average (lower to 1.5-1.8 for stocks, raise to 2.5-3.0 for crypto)
• Velocity: 2.0 ATR (raise to 2.5-3.0 for crypto)
3. Confluence Settings:
• Enable Divergence (highest win rate factor)
• Pivot Lookback: 5 (day trading) | 8-10 (swing trading)
• Keep default weights initially
4. Thresholds:
• Premium: 6.0 (quality over quantity)
• Standard: 4.0 (balanced)
• Warning: 2 factors minimum
Trading Workflow
When Warning Fires (Yellow Diamond):
Note warning type (bearish/bullish)
Do not enter - this is preparation only
Monitor for full signal confirmation
Prepare entry parameters
When Signal Fires (Colored Triangle):
Identify type from color (Purple=DIV, Orange=LIQ, Aqua=OF, Red/Green=STD)
Check dashboard confidence score
Verify confluence on chart (wick, volume, MPI extreme, Fib level)
Confirm with your analysis (context, higher timeframe, news)
Enter with proper risk management
Risk Management (Not Provided by Indicator):
• Stop Loss: Beyond recent swing or 1.5-2.0× ATR
• Position Size: Risk 0.5-2% of capital per trade
• Take Profit: 2-3× ATR or next structural level
Performance Analysis (After 30-50 Signals)
Review Dashboard Statistics:
Overall Win Rate:
• Target >50% for profitability with 1:1.5+ RR
• <45% = system may not suit instrument
• >65% = consider tightening thresholds
Directional Analysis:
• Bullish >> Bearish = uptrend bias, avoid counter-trend shorts
• Bearish >> Bullish = downtrend bias, avoid counter-trend longs
Signal Type Ranking:
• Focus on highest win rate types (typically DIV/LIQ)
• If STD <40% = raise threshold or ignore STD signals
• If premium type <50% = investigate (may need parameter adjustment)
Optimize Settings:
• Too many weak signals → Raise thresholds (premium 7.0-8.0, standard 5.0-6.0)
• Too few signals → Lower thresholds or reduce detection strictness
• Adjust factor weights based on what appears in winning signals
What Makes This Original
1. Proprietary Market Pressure Index
Unique Methodology:
• Proportional intrabar allocation: Unlike binary volume classification (OBV), MPI uses close position within range for proportional pressure assignment
• Dual-timeframe normalization: EMA smoothing (14) + SMA normalization (28) for responsiveness with context
• Bounded oscillator with sensitivity control: -1 to +1 range enables cross-instrument comparison while sensitivity allows customization
• Active signal integration: MPI drives divergence detection, extreme requirements, exhaustion confirmation (not just display)
vs. Existing Indicators:
• MFI uses typical price × volume (different pressure measure)
• CMF accumulates over time (not bounded oscillator)
• OBV is cumulative and binary (not proportional or normalized)
2. Hierarchical Confluence Engine
Why Simple Mashups Fail: Most multi-indicator systems create decision paralysis (RSI says sell, MACD says buy).
This System's Solution:
• Six factors weighted by reliability (3.0 down to 1.0)
• Dual thresholds (premium 6.0, standard 4.0)
• Automatic signal triage by quality tier
• Color-coded visual prioritization
Orthogonal Detection: Each factor detects different failure mode:
• Divergence = momentum exhaustion
• Liquidity = institutional manipulation
• Order Flow = smart money positioning
• Wick = supply/demand rejection
• Volume = participation confirmation
• Velocity = parabolic exhaustion
Complementary, not redundant. Weighted synthesis creates unified confidence measure.
3. Self-Validating Performance System
The Problem: Most indicators never reveal actual performance. Traders never know if it works on their instrument.
This Solution:
• Forward-looking validation (signals tracked to pivot confirmation)
• Pivot-based success criteria (objective, mechanical)
• Segmented statistics (by direction and type)
• Real-time dashboard updates
Result: After 30-50 signals, you have statistically meaningful data on what actually works on your specific market. Transforms indicator into adaptive learning system.
Technical Notes
No Repainting:
• All signals use confirmed bar data (closed bars only)
• Pivot detection has inherent lookback lag (5 bars)
• Divergence lines drawn after confirmation (retroactive visualization)
• Signals fire on bar close
Forward-Looking Disclosure:
• Win rate validation looks forward 10 bars for pivot confirmation
• Creates forward bias in statistics , not signal generation
• Real-time performance may differ until validation period elapses
Lookback Limits:
• Fibonacci/S/R: Limited by limitDrawBars (default 100)
• MPI calculation: 28 bars maximum
• Signal storage: 20 per direction (configurable)
Visual Limits:
• Max lines/labels/boxes: 500 each
• Auto-clearing prevents overflow
Limitations & Disclaimers
Not a Complete Trading System:
• Does not provide stop loss, take profit, or position sizing
• Requires trader risk management and market context analysis
Reversal Bias:
• Designed specifically for reversal trading
• Not optimized for trend continuation or breakouts
Learning Period:
• Statistics meaningless until 20-30 mature signals
• Preferably 50+ for statistical confidence
Instrument Dependency:
• Best: Liquid instruments (major forex, large-caps, BTC/ETH)
• Poor: Illiquid small-caps, low-volume altcoins (order flow unreliable)
Timeframe Dependency:
• Optimal: 15m - 4H charts
• Not Recommended: <5m (noise) or >Daily (insufficient signals)
No Guarantee of Profit:
• Win rate >50% does not guarantee profitability (depends on RR, sizing, execution)
• Past performance ≠ future performance
• All trading involves risk of loss
Warning Signals:
• Warnings are NOT trade signals
• Trading warnings produces lower win rates
• For preparation only
Recommended Settings by Instrument
Forex Majors (15m-1H):
• MPI Sensitivity: 1.3-1.5 | Volume: 2.0 | Thresholds: 6.0/4.0
Crypto BTC/ETH (15m-4H):
• MPI Sensitivity: 2.0-2.5 | Volume: 2.5-3.0 | Velocity: 2.5-3.0 | Thresholds: 6.5-7.0/4.5-5.0
Large-Cap Stocks (5m-1H):
• MPI Sensitivity: 1.2-1.5 | Volume: 1.8-2.0 | Thresholds: 6.0/4.0
Index Futures ES/NQ (5m-30m):
• MPI Period: 10-14 | Sensitivity: 1.5 | Velocity: 1.8-2.0 | Thresholds: 5.5-6.0/4.0
Altcoins High Vol (1H-4H):
• MPI Period: 21 | Sensitivity: 2.0-3.0 | Volume: 3.0+ | Thresholds: 7.0-8.0/5.0 (very selective)
Alert Configuration
Built-In Alerts:
Bullish Signal (all types)
Bearish Signal (all types)
Bullish Divergence (DIV only)
Bearish Divergence (DIV only)
Setup:
• TradingView Alert → Select "Pressure Pivots - MPI"
• Choose condition
• Frequency: "Once Per Bar Close" (prevents repainting)
• Configure notifications (popup/email/SMS/webhook)
Recommended:
• Active traders: Enable all signals
• Selective traders: DIV only (highest quality)
In-Code Documentation
Every input parameter includes extensive tooltips (800+ words total) providing:
• What it controls
• How it affects calculations
• Range guidance (low/medium/high implications)
• Default justification
• Asset-specific recommendations
• Timeframe adjustments
Access: Hover over (i) icon next to any setting. Creates self-documenting learning system—no external docs required.
DskyzInvestments | Trade with insight. Trade with anticipation.

ZynAlgo S&R ProZynAlgo S&R Pro identifies confirmed swing highs and swing lows, marks them on the chart, and draws single horizontal liquidity lines that extend from each confirmed swing until the next swing of the same type occurs. The tool can optionally recolor candles based on whether the current close is above or below the previous close. It also exposes alert conditions for new swing points and for when price reaches the most recent buy-side or sell-side liquidity line.
Important: This is a visual analysis tool. It does not open, manage, or close positions. It is provided for educational and informational purposes only.
How it works (under the hood)
Swing detection (confirmed):
The script uses ta.pivothigh/ta.pivotlow with symmetric left/right bars defined by Left bar & Right bar. A swing is considered only after the bar is confirmed.
Swing markers:
When enabled, confirmed swing highs/lows are marked with small circles above/below bars. The offset equals the left/right length to align with the confirmed pivot location.
Liquidity lines:
On each swing high, the script ends (anchors) the previous buy-side line at the pivot’s bar, then creates a new dotted/dashed/solid horizontal line at that swing price and extends it forward.
On each swing low, it does the same for sell-side lines.
Between swing events, the most recent buy-side and sell-side lines continue extending to the current bar.
Alerts:
Swing High / Swing Low Created — fires on confirmation of a new swing.
Buy Side Liquidity Raid — when price crosses over the most recent swing-high line.
Sell Side Liquidity Raid — when price crosses under the most recent swing-low line.
Optional candle coloring:
If enabled, candles can be recolored by comparing current close to the previous close, with independent toggles for body, borders, and wicks.
Inputs & recommended tooltips (copy-friendly)
Swing High/Low Setting
Left bar & Right bar (len_l)
Tooltip: “Bars to the left/right required to confirm a pivot. Larger values = fewer but stronger swing points (default: 20).”
Show Swing High Swing Low (flg_shsl)
Tooltip: “Plot small circles at confirmed swing highs (red) and swing lows (blue).”
(Note: i_labelcolor_price is present but unused in visible drawings—safe to ignore or reserve for future use.)
Liquidity Pools Settings
Show Liquidity Pools (flg_lq)
Tooltip: “Draw a horizontal line at each confirmed swing. The line extends forward until the next swing of the same type appears.”
Line Width (i_width)
Tooltip: “Thickness of liquidity lines (1–6).”
Line Style (i_linestyle)
Tooltip: “Choose solid, dashed, or dotted style for liquidity lines.”
Buy Side Liquidity Color (i_linecolor_bs)
Tooltip: “Color for swing-high liquidity lines (default: red).”
Sell Side Liquidity Color (i_linecolor_ss)
Tooltip: “Color for swing-low liquidity lines (default: blue).”
Candles
Color bars based on previous close (use_prev_close)
Tooltip: “If enabled, candle colors are based on whether close > previous close (Up) or not (Down).”
Up Color / Down Color
Tooltip: “Colors used for up vs. down determination.”
Body / Borders / Wick (apply toggles)
Tooltip: “Choose which candle parts to recolor.”
Alerts available (names as shown in the Create Alert dialog)
Swing High
Triggers when a new swing high is confirmed. Select this condition to be notified about newly formed swing highs.
Swing Low
Triggers when a new swing low is confirmed.
Buy Side Liquidity Raid
Triggers when price crosses above the most recent swing-high liquidity line (crossover(high, LSH)).
Sell Side Liquidity Raid
Triggers when price crosses below the most recent swing-low liquidity line (crossunder(low, LSL)).
Quick start (suggested workflow)
Add to chart: Apply ZynAlgo S&R Pro to your symbol and timeframe.
Choose sensitivity: Adjust Left bar & Right bar. Higher values focus on more significant swing points; lower values react faster.
Toggle visuals:
Enable Show Swing High Swing Low to see swing markers.
Enable Show Liquidity Pools to draw/extend liquidity lines. Pick the line style, width, and colors you prefer.
(Optional) Candle colors: Turn on Color bars based on previous close and choose which parts to color.
Set alerts:
Open Create Alert → Condition: ZynAlgo S&R Pro → choose Swing High, Swing Low, Buy Side Liquidity Raid, or Sell Side Liquidity Raid as needed.
Practical notes & limitations
Confirmed swings only: Pivots are plotted after confirmation (i.e., once the required left/right bars are complete). This avoids repainting the pivot location.
One active line per side: Only the most recent buy-side and sell-side liquidity lines extend to the right; prior lines are ended when a new swing of the same side appears.
Timeframes & instruments: Parameter sensitivity can vary across markets/timeframes. Consider tuning Left bar & Right bar to match volatility.
No orders are placed: This indicator does not execute trades or manage positions.
Compliance & fair-use guidance
No performance promises: This tool does not guarantee profitable results and should not be described as “signals,” “guaranteed,” “best,” or similar claims. It is an analysis aid that visualizes historical swing points, liquidity levels, and optional candle coloring.
Educational intent: Use it to support your chart review and alerting workflow; combine with your own judgment and risk controls.
Alerts are informational: Alerts reflect the conditions described above and do not constitute financial advice.
Change log (summary of core features)
Swing detection with configurable left/right bars; optional swing markers.
Auto-extending buy-side/sell-side liquidity lines with customizable style/width/colors.
Four alert conditions (new swing highs/lows and liquidity raids).
Optional candle recoloring with separate toggles for body/borders/wicks.
Dynamic Line Management
Unlike static support/resistance tools, ZynAlgo S&R Pro automatically manages the lifecycle of each liquidity line — removing outdated levels the moment new structure forms.
This ensures the chart always reflects the most relevant active zones.
Structure + Liquidity Integration
By combining price structure (swing points) with liquidity visualization, it bridges the gap between classic S&R and modern liquidity-based interpretation — a fusion rarely found in lightweight indicators.
Noise-Free Design
The script plots only the most essential elements: confirmed swings, active liquidity lines, and optional candle color context.
It avoids overlapping labels, text clutter, or unnecessary metrics — ideal for traders who prefer clarity and precision.
Non-Repainting Logic
All pivots are confirmed only after the required right-side bars are closed, ensuring all swing points and lines remain fixed once plotted.
This gives confidence in backtesting and visual analysis without misleading signals.
Lightweight & Efficient
Despite tracking multiple dynamic lines, the algorithm is optimized for performance (using arrays and efficient bar updates), making it suitable for both high- and low-timeframe analysis.
Adaptable Across Market Types
Equally applicable to forex, crypto, indices, and commodities, the algorithm’s sensitivity parameter lets users adjust to volatility differences between instruments.
Purely Analytical
The tool does not provide trade signals or predictions.
Its design supports price-action interpretation, liquidity mapping, and structure confirmation — helping traders read context rather than react to noise.
🔶 RISK DISCLAIMER
Trading is risky & most day traders lose money. All content, tools, scripts, articles, & education provided by ZynAlgo are purely for informational & educational purposes only. Past performance does not guarantee future results.
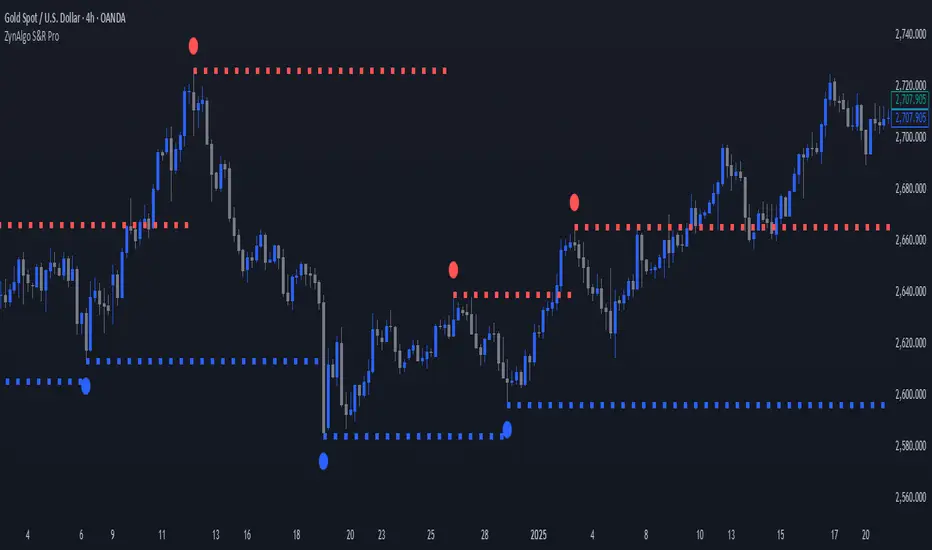
ATR Future Movement Range Projection
The "ATR Future Movement Range Projection" is a custom TradingView Pine Script indicator designed to forecast potential price ranges for a stock (or any asset) over short-term (1-month) and medium-term (3-month) horizons. It leverages the Average True Range (ATR) as a measure of volatility to estimate how far the price might move, while incorporating recent momentum bias based on the proportion of bullish (green) vs. bearish (red) candles. This creates asymmetric projections: in bullish periods, the upside range is larger than the downside, and vice versa.
The indicator is overlaid on the chart, plotting horizontal lines for the projected high and low prices for both timeframes. Additionally, it displays a small table in the top-right corner summarizing the projected prices and the percentage change required from the current close to reach them. This makes it useful for traders assessing potential targets, risk-reward ratios, or option strategies, as it combines volatility forecasting with directional sentiment.
Key features:
- **Volatility Basis**: Uses weekly ATR to derive a stable daily volatility estimate, avoiding noise from shorter timeframes.
- **Momentum Adjustment**: Analyzes recent candle colors to tilt projections toward the prevailing trend (e.g., more upside if more green candles).
- **Time Horizons**: Fixed at 1 month (21 trading days) and 3 months (63 trading days), assuming ~21 trading days per month (excluding weekends/holidays).
- **User Adjustable**: The ATR length/lookback (default 50) can be tweaked via inputs.
- **Visuals**: Green/lime lines for highs, red/orange for lows; a semi-transparent table for quick reference.
- **Limitations**: This is a probabilistic projection based on historical volatility and momentum—it doesn't predict direction with certainty and assumes volatility persists. It ignores external factors like news, earnings, or market regimes. Best used on daily charts for stocks/ETFs.
The indicator doesn't generate buy/sell signals but helps visualize "expected" ranges, similar to how implied volatility informs option pricing.
### How It Works Step-by-Step
The script executes on each bar update (typically daily timeframe) and follows this logic:
1. **Input Configuration**:
- ATR Length (Lookback): Default 50 bars. This controls both the ATR calculation period and the candle count window. You can adjust it in the indicator settings.
2. **Calculate Weekly ATR**:
- Fetches the ATR from the weekly timeframe using `request.security` with a length of 50 weeks.
- ATR measures average price range (high-low, adjusted for gaps), representing volatility.
3. **Derive Daily ATR**:
- Divides the weekly ATR by 5 (approximating 5 trading days per week) to get an equivalent daily volatility estimate.
- Example: If weekly ATR is $5, daily ATR ≈ $1.
4. **Define Projection Periods**:
- 1 Month: 21 trading days.
- 3 Months: 63 trading days (21 × 3).
- These are hardcoded but based on standard trading calendar assumptions.
5. **Compute Base Projections**:
- Base projection = Daily ATR × Days in period.
- This gives the total expected movement (range) without direction: e.g., for 3 months, $1 daily ATR × 63 = $63 total range.
6. **Analyze Candle Momentum (Win Rate)**:
- Counts green candles (close > open) and red candles (close < open) over the last 50 bars (ignores dojis where close == open).
- Total colored candles = green + red.
- Win rate = green / total colored (as a fraction, e.g., 0.7 for 70%). Defaults to 0.5 if no colored candles.
- This acts as a simple momentum proxy: higher win rate implies bullish bias.
7. **Adjust Projections Asymmetrically**:
- Upside projection = Base projection × Win rate.
- Downside projection = Base projection × (1 - Win rate).
- This skews the range: e.g., 70% win rate means 70% of the total range allocated to upside, 30% to downside.
8. **Calculate Projected Prices**:
- High = Current close + Upside projection.
- Low = Current close - Downside projection.
- Done separately for 1M and 3M.
9. **Plot Lines**:
- 3M High: Solid green line.
- 3M Low: Solid red line.
- 1M High: Dashed lime line.
- 1M Low: Dashed orange line.
- Lines extend horizontally from the current bar onward.
10. **Display Table**:
- A 3-column table (Projection, Price, % Change) in the top-right.
- Rows for 1M High/Low and 3M High/Low, color-coded.
- % Change = ((Projected price - Close) / Close) × 100.
- Updates dynamically with new data.
The entire process repeats on each new bar, so projections evolve as volatility and momentum change.
### Examples
Here are two hypothetical examples using the indicator on a daily chart. Assume it's applied to a stock like AAPL, but with made-up data for illustration. (In TradingView, you'd add the script to see real outputs.)
#### Example 1: Bullish Scenario (High Win Rate)
- Current Close: $150.
- Weekly ATR (50 periods): $10 → Daily ATR: $10 / 5 = $2.
- Last 50 Candles: 35 green, 15 red → Total colored: 50 → Win Rate: 35/50 = 0.7 (70%).
- Base Projections:
- 1M: $2 × 21 = $42.
- 3M: $2 × 63 = $126.
- Adjusted Projections:
- 1M Upside: $42 × 0.7 = $29.4 → High: $150 + $29.4 = $179.4 (+19.6%).
- 1M Downside: $42 × 0.3 = $12.6 → Low: $150 - $12.6 = $137.4 (-8.4%).
- 3M Upside: $126 × 0.7 = $88.2 → High: $150 + $88.2 = $238.2 (+58.8%).
- 3M Downside: $126 × 0.3 = $37.8 → Low: $150 - $37.8 = $112.2 (-25.2%).
- On the Chart: Green/lime lines skewed higher; table shows bullish % changes (e.g., +58.8% for 3M high).
- Interpretation: Suggests stronger potential upside due to recent bullish momentum; useful for call options or long positions.
#### Example 2: Bearish Scenario (Low Win Rate)
- Current Close: $50.
- Weekly ATR (50 periods): $3 → Daily ATR: $3 / 5 = $0.6.
- Last 50 Candles: 20 green, 30 red → Total colored: 50 → Win Rate: 20/50 = 0.4 (40%).
- Base Projections:
- 1M: $0.6 × 21 = $12.6.
- 3M: $0.6 × 63 = $37.8.
- Adjusted Projections:
- 1M Upside: $12.6 × 0.4 = $5.04 → High: $50 + $5.04 = $55.04 (+10.1%).
- 1M Downside: $12.6 × 0.6 = $7.56 → Low: $50 - $7.56 = $42.44 (-15.1%).
- 3M Upside: $37.8 × 0.4 = $15.12 → High: $50 + $15.12 = $65.12 (+30.2%).
- 3M Downside: $37.8 × 0.6 = $22.68 → Low: $50 - $22.68 = $27.32 (-45.4%).
- On the Chart: Red/orange lines skewed lower; table highlights larger downside % (e.g., -45.4% for 3M low).
- Interpretation: Indicates bearish risk; might prompt protective puts or short strategies.
#### Example 3: Neutral Scenario (Balanced Win Rate)
- Current Close: $100.
- Weekly ATR: $5 → Daily ATR: $1.
- Last 50 Candles: 25 green, 25 red → Win Rate: 0.5 (50%).
- Projections become symmetric:
- 1M: Base $21 → Upside/Downside $10.5 each → High $110.5 (+10.5%), Low $89.5 (-10.5%).
- 3M: Base $63 → Upside/Downside $31.5 each → High $131.5 (+31.5%), Low $68.5 (-31.5%).
- Interpretation: Pure volatility-based range, no directional bias—ideal for straddle options or range trading.
In real use, test on historical data: e.g., if past projections captured actual moves ~68% of the time (1 standard deviation for ATR), it validates the volatility assumption. Adjust the lookback for different assets (shorter for volatile cryptos, longer for stable blue-chips).

Chanlun FBFD pen czsc Channel Chan Theory
🏆 Chan Zhong Shuo Chan FBFD Pure Segment Version Indicator - Flagship Edition
Background
A decade of craftsmanship, a significant upgrade
This Chanlun indicator has undergone nearly 10 years of meticulous refinement and continuous optimization. Since its initial design in 2015, it has been validated through actual trading. Now newly upgraded and launched on TradingView, it offers more comprehensive functions and superior performance.
It truly implements all core theories from the original Chanlun text, including a complete system of K-line inclusion, fractal recognition, pen and segment analysis, center theory, pure pen and segment division (classification of the first and second cases in the original text), divergence and reversal, providing professional and comprehensive technical analysis tools for Chanlun enthusiasts in the industry.
Chinese Translation for User Indicator Interface:
● 顶背离: Top Divergence
● 底背离: Bottom Divergence
● 顶背驰: Top Divergence Including Trend Structure
● 底背驰: Bottom Divergence Including Trend Structure
📦 Parameter Settings
● Number of K-lines to calculate: Up to 5000, which is the maximum data available even for free TradingView users
● Pen detail parameters: Old/new pens, sub-high/low pens, high/low pens, strict pens can be adjusted and selected according to the target numbers
● Segment detail parameters: Adjustable
● MA and Bollinger Bands display parameters: Check to display, uncheck to hide as needed
● Center price and pen/segment price display: Check to display, uncheck to hide as needed
● MACD parameters: Can be adjusted as needed, including fast, slow, and signal line period settings
● MA parameters: Default parameters can be manually adjusted
● Pen divergence, segment divergence, pen-segment reversal display: Check to display, uncheck to hide as needed
● Pen-segment divergence and reversal alerts: Disabled by default, can be enabled by checking. Then in TradingView's alert interface, select the indicator in conditions, set "Any alert() function call", set notification type, and create the alert to receive notifications
🔥 Integration of other commonly used indicators and reasons:
✅ Moving Averages: Since Chanlun uses MA overlay analysis, this makes it more convenient for users to analyze trends from different perspectives, so it's essential to add
✅ Bollinger Bands: Bollinger Bands channel, combined with Chanlun, can also provide more perspectives for trend analysis and improve accuracy, so it's also added
✅ MACD: This is an indispensable indicator for analyzing trend strength in Chanlun theory, so it must be integrated for convenient analysis
✅ Chanlun ZSLX pen czsc Channel Chan Theory and Chanlun FBFD pen czsc Channel Chan Theory scripts share some underlying source code and must be integrated because:
The underlying K-line inclusion, MACD divergence and reversal, K-line objects, and pen parts in the original Chanlun text are the same, but the top-level segment and trend recursion division principles, display effects, and functions are significantly different. Additionally, TradingView community has source code quantity restrictions, making it impossible to fully integrate the two versions into one. Therefore, the kxian object returned by the Start_kxian function, the bi object returned by the Start_bi function, the source code for drawing K-line centers in showKxianzsfunc, and the MACD divergence and reversal judgment code in this script will have integrated parts with the same source code.
🎯 Technical Principles
🔥 1. Comprehensive coverage of original Chanlun functions
✅ Multi-level center combination - pen centers, K-line centers, segment centers
● Chanlun K-line centers: The lowest level Chanlun centers
● Chanlun pen centers: Pen center division intervals from the original text, taking the lowest point of the overlapping part as the high point and the highest point of the overlapping part as the low point
● Chanlun segment centers: Segment center division intervals from the original text, taking the lowest point of the segment overlapping part as the high point and the highest point of the segment overlapping part as the low point
✅ Divergence and reversal warning - divergence and reversal algorithm
● Principle: Adopts MACD strength statistics from the original Chanlun text, distinguishes between divergence/reversal in pen structures and segment structures, marks specific values on the graph, differentiates MACD strength between pens and segments. This will be further upgraded with more complex statistics in the future, but currently serves as a reference for the current cycle. Specific analysis still requires multi-cycle strength analysis.
✅ Original two-level pure segmentation - exclusive algorithm
● Principle: Strictly follows segment division from the original text, distinguishing between the first and second cases, as well as special fractal inclusion processing for the second case, and segment rules. Some segments may not end at the highest or lowest points.
✅ Real-time K-line inclusion processing - intelligent recognition of inclusion relationships
● In rising K-lines, take the higher high and higher low values (take the higher among highs)
● In falling K-lines, take the lower high and lower low values (take the lower among lows)
✅ Accurate fractal marking - automatic recognition of top and bottom fractals
● By setting the old/new pen parameter to 2, the high and low points of each top and bottom fractal will be drawn
● Top fractal: Among three K-lines, the middle K-line has a higher high and a higher low than both sides
● Bottom fractal: Among three K-lines, the middle K-line has a lower low and a lower high than both sides
✅ Multi-dimensional pen and segment analysis - complete system of pens and segments
● Old pens: Traditional strict pen definition in Chanlun, consistent with the original text
● New pens: Traditional new pen definition in Chanlun, meeting the relaxed pen conditions in the original text
● Fractal pens: Pens formed by top and bottom fractals, with sensitive price response (many peers mark fractal pens of this cycle as sub-level)
● Segments: This version adopts a recursive approach, treating some pens as segments in certain places. Most places are the same as pure segmentation, but with different line-drawing principles
✅ Multi-level center combination - K-line centers, pen centers, segment centers
● K-line centers: The smallest level Chanlun centers
● Pen centers: Adopt pen center division intervals from the original text, taking the lowest point of the overlapping part as the high point and the highest point of the overlapping part as the low point
● Segment centers: Adopt segment center division intervals from the original text, taking the lowest point of the segment overlapping part as the high point and the highest point of the segment overlapping part as the low point
⚙️ Indicator Features
⚙️ 1. Diversified pen and segment algorithm engine
🎨 Three pen algorithms: "Chanlun old pen", "Chanlun new pen", "top-bottom fractal pen", with more custom pen types to be added later
🔧 Common parameter adjustments: Equal high/low points, highest/lowest point pens, sub-high/low pens, fractal interval judgment, and other refined controls
📊 Dual segment division: Original pure segmentation + large-level segmentation
🎯 Multiple personalized parameter adjustments: Many other different parameters to meet different Chanlun enthusiasts' understanding needs and trading styles
🌟 2. Multi-level intelligent combination system
📈 Synchronous calculation and display: K-line centers, pens, pen centers, segments, large-level segments, segment center linkage analysis
🏗️ Exclusive pure segmentation algorithm: Accurately identifies first and second case segment divisions
🎪 Multi-level center system: Complete coverage of three center levels
📊 Panoramic market analysis: Provides comprehensive market dynamic insights
🎨 3. Professional visual customization
🌈 Custom color schemes - perfectly matching personal chart styles
💰 Price label display - marking of key price levels for pens, segments, and centers
📐 Professional auxiliary tools - practical functions such as moving averages and Bollinger Bands
🎁 MACD - supporting indicator in the sub-chart
⏰ 4. Perfect K-line replay support
🔄 Historical data review - perfectly supports TradingView replay function
📚 Market research tool - enhances historical trend analysis capabilities
🧠 Decision-making ability enhancement - deepens market insight and judgment level
📦 Product Versions
🥇 Version 1: Professional Segmentation Edition
Suitable for: Traditional Chanlun enthusiasts pursuing classic segmentation algorithms
Core functions:
🔸 Multiple pen algorithms: Fractal pens, new pens, old pens, sub-high/low pens, highest/lowest pens
🔸 Pen and segment detail adjustments: Massive parameters supporting various pen division schemes
🔸 Complete center system: K-line centers, pen centers, segment centers
🔸 Intelligent warning system: Divergence and reversal prompts and alarm functions
🔸 Recursive large levels: Current level and large-level segmentation analysis
**📊
💡 Peer comparison: The "professional version" functions of other platforms are just basic configurations here
🎊 Experience now and start your professional Chanlun analysis journey!
Pre-sales note: The Chan Zhong Shuo Chan theory is relatively complex. The software tries its best to implement the functions described in the original text, but there may still be some flaws that cannot be handled perfectly. These will be gradually improved in the future. Customers who are concerned about this can try it for a few days first, purchase it if they find it suitable, or treat it as a test if not. We welcome everyone to feedback problems and bugs, and the shopkeeper will update, modify, and optimize in the future when available.
1. K-line inclusion from the original text
2. Pen and segment multi-level divergence and reversal prompts
3. More than three types of pens that can be adjusted
4. Including pen and segment area strength statistics + center high and low price display
5. Three-level center (K-line center, pen center, segment center) detailed analysis
6. Multiple moving averages display
7. Commonly used superimposed Bollinger Bands
8. Original text segment division rules with 2-level segments
9. Some alarm functions designed, including divergence and reversal, with more to be added in the future
10. A total of dozens of optional parameter settings
11. Free trial
🏆 缠中说禅FBFD 纯分段版指标 - 旗舰版
背景
十年匠心,重磅升级
这套缠中说禅指标历经近10年的精心打磨与持续优化,从2015年初版设计至今,已经过实战验证。现全新升级登陆TradingView,功能更加完善,性能更加卓越。
真正实现了缠论原文中的所有核心理论,包括K线包含、分型识别、笔段分析、中枢理论、 纯分笔分段(原文第一种和第二种情况分类)、背离背驰等完整体系,为缠论爱好者提供业界专业、全面的技术分析工具。
📦参数设置
- 计算K线数量:最多计算5000根,免费tradingview用户也只能这么多数据
- 笔细节参数:新旧笔、次高低点笔、最高低点笔、严格笔 可以调整可按标的数字选
● - 线段细节参数: 调整
- 显示均线和布林线参数:根据需要设置打钩就是显示,取消打钩就是隐藏
- 显示中枢价格和笔段价格:根据需要设置打钩就是显示,取消打钩就是隐藏
- macd参数:可以根据自己需要调整参数 快 慢 信号线周期设置
- 均线参数:默认参数可以自己手动调整
- 显示笔背离、段背离、笔段背驰:根据需要设置打钩就是显示,取消打钩就是隐藏
- 笔段背离背驰报警:默认关闭可以设置打钩开启,然后在tradingview的警报界面,条件里选择指标,设置:任何alert()函数调用,再设置通知类型,然后创建报警就可以收到报警
🔥整合其他常用指标和原因:
✅均线:因为缠论里是有使用均线叠加分析,这种更方便用户从不同视角分析走势,所以必须增加
✅布林线:布林线通道,结合缠论,也可以更多的视角分析走势,提高准确度,所以也增加了
✅macd:这个是缠论分析理论里必不可少的分析走势力度的指标,所以也必须整合进来方便分析
✅Chanlun ZSLX pen czsc Channel Chan Theory这个脚本和Chanlun FBFD pen czsc Channel Chan Theory这个脚本有些底层的源码是一样的必须整合原因:
因为缠论原文底层的K线包含、macd背离背驰、K线对象和笔部分都是一样的,但是顶层的线段和走势递归两种划分原理和显示效果和功能是有很大区别,并且tradingview社区的源码量有限制,导致也无法两个版本划线完全整合成一个,所以,这个脚本里的Start_kxian函数返回的kxian对象、 Start_bi函数返回的bi 对象 、showKxianzsfunc画K线中枢部分的源码、macd背离背驰判断部分代码,会有一样的整合部分源码
🎯 技术原理
🔥 1. 全方位缠论原文功能覆盖
● ✅ 多级中枢联立 - 笔中枢、K线中枢、线段中枢
○ - 缠论K线中枢:最低级别的缠论中枢
- 缠论笔中枢:原文的笔中枢划分区间,高点取重叠部分的最低点,低点取重叠部分最高点
- 缠论线段中枢:原文的线段中枢划分区间,高点取线段重叠部分的最低点,低点取线段重叠部分最高点
● ✅ 背离背驰预警 - 背离背驰算法
○ - 原理:采用缠论原文的macd力度统计,区分笔结构的背离背驰和段结构的背离背驰,并且在图形上标上具体数值,区分笔和段的macd力度,后期这个还要继续升级更复杂的统计,仅做本周期的参考,具体也是要多周期力度分析
● ✅ 原文两级别纯分段 - 独家算法
- 原理:严格按原文的线段划分,区分第一种情况和第二种情况,以及特殊的第二种情况分型包含处理,线段规则,有的地方可能不是结束在最高最低点
● ✅ 实时K线包含处理 - 智能识别包含关系
○ - 上涨K线中取高点高值、低点高值,高高取高
- 下跌K线中取高点低值、低点低值,低低取低
● ✅ 精准分型标记 - 顶底分型自动识别
○ - 通过新旧笔参数设置2,会画出每个顶底分型高低点
○ - 顶分型:三根k线中,中间K线高点高于两侧K线,低点也高于两侧
- 底分型:三根k线中,中间K线低点低于两侧K线,高点也低于两侧
● ✅ 多维笔段分析 - 笔、线段完整体系
○ - 老笔:传统缠论严格笔定义,符合原文
- 新笔:传统缠论新笔定义,符合原文宽松笔条件
- 分型笔:顶底分型就成笔,价格反应比较敏锐(同行很多人把本周期分型笔标成次级别)
○ - 线段:这个版本采用递归思路,有的地方一笔处理成段,大部分地方跟纯分段一样,但是划线原理不同
● ✅ 多级中枢联立 - K线中枢、笔中枢、线段中枢
○ - K线中枢:最小级别的缠论中枢
- 笔中枢:采用原文的笔中枢划分区间,高点取重叠部分的最低点,低点取重叠部分最高点
- 线段中枢:采用原文的线段中枢划分区间,高点取线段重叠部分的最低点,低点取线段重叠部分最高点
⚙️ 指标特点
⚙️ 1. 多样化笔段算法引擎
● 🎨 三种笔算法: "缠论旧笔"、"缠论新笔"、"顶底分型笔",以及后面会增加更多自定义类型笔选择
● 🔧 常见参数调节: 等高低点、最高低点笔、次高低笔、分型区间判断等精细化控制
● 📊 双重段划分: 原文纯分段 +大级别分段
● 🎯 超多个性化参数调整: 还有很多其他不同参数,满足不同缠友的理解需求与交易风格
🌟 2. 多级别智能联立系统
● 📈 同步计算显示: K线中枢、笔、笔中枢、线段、大级别线段、线段中枢联动分析
● 🏗️ 独家纯分段算法: 精确识别第一种、第二种情况线段划分
● 🎪 多级中枢体系: 三重中枢级别完整覆盖
● 📊 全景市场分析: 提供全面的市场动态洞察
🎨 3. 专业视觉定制
● 🌈 自定义配色方案 - 完美匹配个人图表风格
● 💰 价格标识显示 - 笔、段、中枢关键价位标注
● 📐 专业辅助工具 - 均线、布林线等实用功能
● 🎁 MACD - 配套附图指标
⏰ 4. 完美K线回放支持
● 🔄 历史数据回顾 - 完美支持TradingView回放功能
● 📚 市场研究利器 - 提升历史走势分析能力
● 🧠 决策能力增强 - 深化市场洞察与判断水平
📦 产品版本
🥇 版本一:专业分段版
适合:传统缠论爱好者,追求经典分段算法
核心功能:
● 🔸 多种笔算法: 分型笔、新笔、旧笔、次高低点笔、最高低点
● 🔸 笔段细节调整: 海量参数支持各种笔划分方案
● 🔸 完整中枢体系: K线中枢、笔中枢、段中枢
● 🔸 智能预警系统: 背离背驰提示及报警功能
● 🔸 递归大级别: 本级别、大级别分段分析
**📊
💡 同行对比: 其他平台的"专业版"功能,在我们这里只是基础配置
🎊 立即体验,开启专业缠论分析之旅!
售前说明:缠中说禅理论,相对比较复杂,软件尽量实现原文的功能,但是也难免有些瑕疵地方,无法处理到位,这边后期会陆续完善,介意的客户可以先试用几天,觉得合适再买,不合适就当测试下,欢迎大家反馈问题和bug,掌柜有空会后期更新修改和优化
1.原文的K线包含
2.笔段多级别背离背驰提示
3.超过三种笔可以调整
4.包含笔段面积力度统计+中枢高低点价格显示
5.三级别中枢(K线中枢 笔中枢 段中枢)精细分析
6.多个均线显示
7.常用叠加布林
8.原文线段划分规则,并且做2级别段
9.设计了一些报警功能,背离背驰等,后期还会陆续完善
10.总共几十个可选参数设置
11.免费试用

Chanlun ZSLX pen czsc Channel Chan Theory🏆 Chanzhongshuochan (CZSC) ZSLX Recursive Version Indicator - Flagship Edition
Background
A Decade of Craftsmanship, a Major Upgrade
This Chanzhongshuochan (Chan Theory) indicator has undergone nearly 10 years of meticulous refinement and continuous optimization. Since its initial design in 2015, it has been validated through real trading practice. Now, it makes its debut on TradingView with a brand-new upgrade, featuring more comprehensive functions and superior performance.
It truly implements all core theories from the original Chan Theory texts, including a complete system covering candlestick containment processing, fractal identification, pen-segment analysis, pivot zone theory, trading signal (buy/sell point) positioning, and divergence analysis. It serves as a professional and all-encompassing technical analysis tool for Chan Theory enthusiasts in the industry.
🎯 Chinese Translation for User Indicator Interface:
● 顶背离: Top Divergence
● 底背离: Bottom Divergence
● 顶背驰: Top Divergence Including Trend Structure
● 底背驰: Bottom Divergence Including Trend Structure
● 趋势: Trend
● 盘整: Consolidation
● 扩张: Expansion
● 大级别盘整: Higher-Timeframe Consolidation
● 一买: First Buy Signal
● 二买: Second Buy Signal
● 类二买:Quasi-Second Buy Signal
● 三买: Third Buy Signal
● 一卖: First Sell Signal
● 二卖: Second Sell Signal
● 类二卖:Quasi-Second Sell Signal
● 三卖: Third Sell Signal
📦 Parameter Settings
● Number of Candlesticks for Calculation: Up to 5,000 candlesticks. Even free TradingView users are limited to this data volume.
● Pen Detail Parameters: Adjustable options include "Old Pen", "New Pen", "Pen Based on Secondary High/Low", "Pen Based on Absolute High/Low", and "Strict Pen". Select via numerical options corresponding to each type.
● MA (Moving Average) and Bollinger Bands Display Parameters: Check the box to enable display; uncheck to hide (configure as needed).
● Pivot Zone Price & Pen-Segment Price Display: Check the box to enable display; uncheck to hide (configure as needed).
● MACD Parameters: Adjustable according to personal needs (set the periods for fast EMA, slow EMA, and signal line).
● MA Parameters: Default values can be manually adjusted.
● Pen Divergence, Segment Divergence, & Pen-Segment Divergence Display: Check the box to enable display; uncheck to hide (configure as needed).
● Pen-Segment Divergence Alert: Disabled by default. Enable by checking the box. To set up alerts:
a. Go to TradingView’s "Alerts" interface.
b. Under "Condition", select this indicator.
c. Choose "Any alert() function call".
d. Set the notification type, then create the alert to receive notifications.
🔥 Integration of Other Common Indicators & Rationale
● ✅ Moving Average (MA): Chan Theory inherently uses MA overlay for analysis. Adding MA here allows users to analyze price trends from multiple perspectives, making it an essential inclusion.
● ✅ Bollinger Bands: Combining Bollinger Bands (a price channel tool) with Chan Theory provides additional perspectives for trend analysis and improves accuracy, hence its integration.
● ✅ MACD: A 不可或缺 (indispensable) indicator for analyzing trend strength in Chan Theory. It is integrated to facilitate seamless analysis.
● ✅ Rationale for Integrating Shared Core Code between Two Scripts:
The scripts Chanlun ZSLX pen czsc Channel Chan Theory and Chanlun FBFD pen czsc Channel Chan Theory share some underlying code. Here’s why integration is necessary:
○ The core logics of the original Chan Theory — including candlestick containment processing, MACD divergence analysis, candlestick objects, and pen-related calculations — are identical in both scripts.
○ However, significant differences exist in the top-level logics for segment division, trend recursion, display effects, and functions.
○ Additionally, TradingView imposes limits on script code size, making it impossible to fully integrate the two versions’ line-drawing features into one.
○ Therefore, this indicator reuses shared code components, including:
■ The Start_kxian() function (returns candlestick objects),
■ The Start_bi() function (returns pen objects),
■ The showKxianzsfunc() function (draws candlestick-based pivot zones),
■ MACD divergence judgment code.
🎯 Technical Principles
🔥 1. Comprehensive Coverage of Original Chan Theory Functions
● ✅ Real-Time Candlestick Containment Processing – Intelligent Recognition of Containment Relationships
○ In uptrends: Select the higher high and higher low values (prioritize higher extremes).
○ In downtrends: Select the lower high and lower low values (prioritize lower extremes).
● ✅ Accurate Fractal Marking – Automatic Identification of Top/Bottom Fractals
○ When the "Old/New Pen" parameter is set to 2, the high/low points of each top/bottom fractal are plotted.
○ Top Fractal: Among three consecutive candlesticks, the middle candlestick has a higher high and a higher low than the adjacent two.
○ Bottom Fractal: Among three consecutive candlesticks, the middle candlestick has a lower low and a lower high than the adjacent two.
● ✅ Multi-Dimensional Pen-Segment Analysis – Complete System for Pens & Segments
○ Pens:
■ Old Pen: Strictly follows the traditional Chan Theory definition of "pen".
■ New Pen: Adheres to the more flexible "new pen" definition from the original Chan Theory.
■ Fractal Pen: Forms a pen directly from top/bottom fractals (responds to price changes; many peers misclassify this as a "sub-timeframe pen").
○ Segments: This version adopts a recursive logic. While some single pens are treated as segments (differing from pure segment division), most segment-drawing results align with standard methods — the core difference lies in the line-drawing logic.
● ✅ Multi-Level Pivot Zone Integration – Candlestick-, Pen-, & Segment-Based Pivot Zones
○ Candlestick Pivot Zone: The smallest-level pivot zone in Chan Theory.
○ Pen Pivot Zone: Follows the original Chan Theory for division — the zone’s high is the lowest high of overlapping pens; the zone’s low is the highest low of overlapping pens.
○ Segment Pivot Zone: Follows the original Chan Theory for division — the zone’s high is the lowest high of overlapping segments; the zone’s low is the highest low of overlapping segments.
● ✅ Intelligent Trading Signals – Accurate Positioning of Three Types of Buy/Sell Points
○ Type 1 Buy/Sell Signal
■ Principle: Based on Chan Theory’s "trend divergence" — momentum weakens when a trend structure forms.
■ Analysis Method: Identify bottom divergence (for buys) or top divergence (for sells) in the final pivot zone of a trend structure.
■ Application: For reference only. Comprehensive analysis requires combining momentum decay across multiple timeframes.
○ Type 2 Buy/Sell Signal
■ Principle: The first pullback low (for buys) or rebound high (for sells) after a Type 1 signal concludes.
■ Analysis Method: After a Type 1 structure forms, prices may occasionally break previous lows/highs.
■ Application: For reference only. Comprehensive analysis requires combining momentum decay across multiple timeframes.
○ Type 3 Buy/Sell Signal
■ Principle: A standard Type 3 buy signal occurs when prices break above the first pivot zone after a Type 1 buy, then pull back to test the zone. For ease of monitoring, all "breakout + pullback" patterns are marked as Type 3 signals here.
■ Identification Method: Beginners are advised to trade standard Type 3 structures (post-Type 1 signals), though such structures are relatively rare.
■ Application: For reference only. Comprehensive analysis requires combining momentum decay across multiple timeframes.
● ✅ Divergence Alert – Exclusive Divergence Algorithm
○ Principle: Uses MACD momentum statistics from the original Chan Theory to distinguish between "pen-structure divergence" and "segment-structure divergence". Specific values are labeled on the chart to differentiate MACD momentum for pens vs. segments. More complex statistical features will be added in future updates. For reference on the current timeframe only — multi-timeframe momentum analysis is still required.
● ✅ Trend Structure Recursion – Exclusive Trend Recursion Function
○ Principle: This is a "same-timeframe decomposition" version of trend types. Trends end as close to absolute highs/lows as possible. Some single pens may be treated as segments, resulting in more natural-looking trend structures.
⚙️ Indicator Features
🌟 1. Diverse Pen-Segment Algorithm Engines
● 🎨 Three Pen Algorithms: "Traditional Old Pen", "New Pen", "Top/Bottom Fractal Pen".
● 🔧 Extensive Parameter Adjustments: Fine-grained control over "secondary high/low pens", "fractal range judgment", etc.
● 📊 Dual Recursive Division: Recursion starting from pens + higher-timeframe recursion.
● 🎯 Customizable Parameters: Adapts to different Chan Theory interpretations and trading styles.
🌟 2. Multi-Level Intelligent Integration System
● 📈 Synchronized Calculation & Display: Linked analysis of pens, segments, and advanced recursive segments.
● 🏗️ Exclusive Recursion Algorithm: Accurate identification of advanced recursive segments.
● 🎪 Multi-Level Pivot Zone System: Full coverage of three pivot zone levels (candlestick, pen, segment).
● 📊 Holistic Market Analysis: Provides comprehensive insights into real-time market dynamics.
🎨 3. Professional Visual Customization
● 🌈 Custom Color Schemes: Perfectly matches personal chart styles.
● 💰 Price Label Display: Marks key prices for pens, segments, and pivot zones.
● 📐 Professional Auxiliary Tools: Practical features like MA and Bollinger Bands.
● 🎁 Included MACD: A supporting indicator for the sub-chart.
⏰ 4. Seamless Candlestick Replay Support
● 🔄 Historical Data Review: Fully compatible with TradingView’s replay function.
● 📚 Powerful Market Research Tool: Enhances the ability to analyze historical price trends.
● 🧠 Improved Decision-Making: Deepens market insights and judgment.
📦 Feature & Interface Showcase by Product Version
Advanced Recursive Version ⭐ Exclusive Algorithm
Suitable for: Advanced Chan Theory users seeking precise trend analysis.
Exclusive Features:
● 🚀 Rare Algorithm: A pure recursive version (most competitors only reach segment-level analysis, which is their limit).
● 🎯 Optimized High/Low Points: Trend endpoints are accurately positioned at absolute highs/lows.
● 🏆 Natural Trend Structures: More natural and rational distribution of high/low points.
● 💎 Complete Chan Theory Elements: Covers all core components of Chan Theory.
● ⚡ Rich Pen Details: Extremely detailed processing of pen structures.
User Feedback: The preferred version among many senior Chan Theory users, with excellent real-trading performance.
Screenshot:
---
🎊 Experience Now & Start Your Professional Chan Theory Analysis Journey!
Pre-Purchase Notes
Chanzhongshuochan (Chan Theory) is relatively complex. While this software strives to implement all functions from the original texts, minor imperfections or unaddressed details may exist — these will be gradually improved in future updates.
● Users with concerns are advised to test the indicator for a few days first. Purchase only if it meets your needs; otherwise, treat the test as a trial.
● Feedback on issues or bugs is welcome. The developer will update, modify, and optimize the indicator in their spare time.
Key Function Screenshots
1. Multi-Level Recursion
2. Candlestick Containment Processing
3. Area Statistics + Pivot Zone High/Low Price Display
4. Multi-Level Consolidation Divergence
5. Overlaid Practical Moving Averages
6. Fractal Pens
7. Candlestick-Based Pivot Zones
8. Dozens of Adjustable Parameters
9. Optional Alert Functions (More to be Added in Future Updates)
10. Trend Structure Markers
🏆 缠中说禅ZSLX 递归版指标 - 旗舰版
背景
十年匠心,重磅升级
这套缠中说禅指标历经近10年的精心打磨与持续优化,从2015年初版设计至今,已经过实战验证。现全新升级登陆TradingView,功能更加完善,性能更加卓越。
真正实现了缠论原文中的所有核心理论,包括K线包含、分型识别、笔段分析、中枢理论、买卖点定位、背离背驰等完整体系,为缠论爱好者提供业界专业、全面的技术分析工具。
📦参数设置
- 计算K线数量:最多计算5000根,免费tradingview用户也只能这么多数据
- 笔细节参数:新旧笔、次高低点笔、最高低点笔、严格笔 可以调整可按标的数字选
- 显示均线和布林线参数:根据需要设置打钩就是显示,取消打钩就是隐藏
- 显示中枢价格和笔段价格:根据需要设置打钩就是显示,取消打钩就是隐藏
- macd参数:可以根据自己需要调整参数 快 慢 信号线周期设置
- 均线参数:默认参数可以自己手动调整
- 显示笔背离、段背离、笔段背驰:根据需要设置打钩就是显示,取消打钩就是隐藏
- 笔段背离背驰报警:默认关闭可以设置打钩开启,然后在tradingview的警报界面,条件里选择指标,设置:任何alert()函数调用,再设置通知类型,然后创建报警就可以收到报警
🔥整合其他常用指标和原因:
✅均线:因为缠论里是有使用均线叠加分析,这种更方便用户从不同视角分析走势,所以必须增加
✅布林线:布林线通道,结合缠论,也可以更多的视角分析走势,提高准确度,所以也增加了
✅macd:这个是缠论分析理论里必不可少的分析走势力度的指标,所以也必须整合进来方便分析
✅Chanlun ZSLX pen czsc Channel Chan Theory这个脚本和Chanlun FBFD pen czsc Channel Chan Theory这个脚本有些底层的源码是一样的必须整合原因:
因为缠论原文底层的K线包含、macd背离背驰、K线对象和笔部分都是一样的,但是顶层的线段和走势递归两种划分原理和显示效果和功能是有很大区别,并且tradingview社区的源码量有限制,导致也无法两个版本划线完全整合成一个,所以,这个脚本里的Start_kxian函数返回的kxian对象、 Start_bi函数返回的bi 对象 、showKxianzsfunc画K线中枢部分的源码、macd背离背驰判断部分代码,会有一样的整合部分源码
🎯 技术原理
🔥 1. 全方位缠论原文功能覆盖
● ✅ 实时K线包含处理 - 智能识别包含关系
○ - 上涨K线中取高点高值、低点高值,高高取高
- 下跌K线中取高点低值、低点低值,低低取低
● ✅ 精准分型标记 - 顶底分型自动识别
○ - 通过新旧笔参数设置2,会画出每个顶底分型高低点
○ - 顶分型:三根k线中,中间K线高点高于两侧K线,低点也高于两侧
- 底分型:三根k线中,中间K线低点低于两侧K线,高点也低于两侧
● ✅ 多维笔段分析 - 笔、线段完整体系
○ - 老笔:传统缠论严格笔定义,符合原文
- 新笔:传统缠论新笔定义,符合原文宽松笔条件
- 分型笔:顶底分型就成笔,价格反应比较敏锐(同行很多人把本周期分型笔标成次级别)
○ - 线段:这个版本采用递归思路,有的地方一笔处理成段,大部分地方跟纯分段一样,但是划线原理不同
● ✅ 多级中枢联立 - K线中枢、笔中枢、线段中枢
○ - K线中枢:最小级别的缠论中枢
- 笔中枢:采用原文的笔中枢划分区间,高点取重叠部分的最低点,低点取重叠部分最高点
- 线段中枢:采用原文的线段中枢划分区间,高点取线段重叠部分的最低点,低点取线段重叠部分最高点
● ✅ 智能买卖点 - 三类买卖点精准定位
○ 1类买卖点
- 原理:基于缠论趋势背驰原理,形成趋势结构时候,力度减弱
- 分析方法:通过判断趋势结构中最后中枢形成底背驰
- 应用:只是参考,具体分析需要多周期力度衰减结合判断
2类买卖点
- 原理:基于1类买卖点结束后,第一个回调低点
- 分析方法:在形成一类结构后,有时候也会破低点
- 应用:只是参考,具体分析需要多周期力度衰减结合判断
3类买卖点
- 原理:标准的三买是在1买形成后,突破第一个中枢的第一个回踩,这边为了方便看盘,统一突破回踩就标三买
- 识别方法:新手建议选择一类买点后的标准三买结构操作,但是可能这种结构比较少
- 应用:只是参考,具体分析需要多周期力度衰减结合判断
● ✅ 背离背驰预警 - 独家背离背驰算法
○ - 原理:采用缠论原文的macd力度统计,区分笔结构的背离背驰和段结构的背离背驰,并且在图形上标上具体数值,区分笔和段的macd力度,后期这个还要继续升级更复杂的统计,仅做本周期的参考,具体也是要多周期力度分析
● ✅ 走势结构递归 - 独家走势递归功能
- 原理:走势类型版本,这个是同级别分解版本,走势尽量结束在最高最低点,有的地方可能一笔成段,· 走势更为自然
⚙️ 指标特点
🌟1. 多样化笔段算法引擎
○ 🎨 三大笔算法: "传统旧笔"、"新笔"、"顶底分型笔"
○ 🔧 海量参数调节: 次高低笔、分型区间判断等精细化控制
○ 📊 双重递归划分: 笔开始递归 + 大级别递归
○ 🎯 个性化参数调整: 满足不同缠友的理解需求与交易风格
🌟 2. 多级别智能联立系统
○ 📈 同步计算显示: 笔、线段、递归高级段联动分析
○ 🏗️ 独家递归算法: 高级递归段精准识别
○ 🎪 多级中枢体系: 三重中枢级别完整覆盖
○ 📊 全景市场分析: 提供全面的市场动态洞察
🎨 3. 专业视觉定制
○ 🌈 自定义配色方案 - 完美匹配个人图表风格
○ 💰 价格标识显示 - 笔、段、中枢关键价位标注
○ 📐 专业辅助工具 - 均线、布林线等实用功能
○ 🎁 附带MACD - 配套附图指标
⏰ 4. 完美K线回放支持
○ 🔄 历史数据回顾 - 完美支持TradingView回放功能
○ 📚 市场研究利器 - 提升历史走势分析能力
○ 🧠 决策能力增强 - 深化市场洞察与判断水平
📦 产品版本功能界面展示
高级递归版 ⭐ 独家算法
适合:高阶缠友,追求极致走势分析
独家特色:
● 🚀 全网罕见算法: 纯递归版本,其他家最多只能设计到分段级别就是极限了
● 🎯 优化高低点: 走势结束点精准定位最高最低点
● 🏆 自然走势结构: 高低点分布更加自然合理
● 💎 完整缠论元素: 涵盖所有缠论核心要素
● ⚡ 超丰富笔细节: 笔的处理细节极其丰富
🌟 客户反馈: 众多资深缠友首选版本,实战效果卓越
快照
---
🎊 立即体验,开启专业缠论分析之旅!
售前说明:缠中说禅理论,相对比较复杂,软件尽量实现原文的功能,但是也难免有些瑕疵地方,无法处理到位,这边后期会陆续完善,介意的客户可以先试用几天,觉得合适再买,不合适就当测试下,欢迎大家反馈问题和bug,掌柜有空会后期更新修改和优化
1.多级别递归
2.K线包含
3.面积统计+中枢高低点价格显示
4.多级别盘整背离背驰
5.叠加实用均线
6.分型笔
7。k线中枢
8.几十个可选参数调整
9,可选的一些报警功能,后期陆续完善,更丰富
10.走势结构标志

SMC ToolBox [WinWorld]👋 INTRODUCTION
SMC ToolBox indicator is not just a simple indicator, but rather a collection of SMC-related algorithms, that our teams has found to make the most profound impact on determination process of the most high-quality liquidity zones and points of interests ( further – POIs ), hence the name of the indicator – Tool Box (and it also sounds cool :) .
From candle patterns to complex orderflow detection algorithm, ToolBox indicator will help any trader with search for useful tools, solving the needs from confirming position entry levels to trend-following and mean reversion opportunities.
❓ WHY DID WE BUILD THIS?
This indicator was initially built for our team's internal use for the sole purpose of gathering all actively used non-structure-related algorithms* in one place, so we could have only the tools that are truly needed at hand at any point of time. After we showed this tool to our trading partners, they were surprised about how light, fast and useful ToolBox was and they advised us on sharing this with our community and, after giving it a proper thought, we decided to follow their advice.
Funnily enough , after researching TradingView's open-source script library, we haven't found even one instance of even remotely alike indicators, so it fair to say that we are one of the first people to release this kind of SMC-related indicator bundles on the market and we strongly that TradingView's community will find this tool of use.
🤷♂️ WHY SHOULD YOU CARE AT ALL?
Frankly speaking, we are not the first people to build our own algorithms of such popular indicators like Equal Highs and Lows (EQHL), Previous Day High Low (PDHL), Orderflow (OF) and etc., but we are definitely one of the first teams to implement these indicators with the help of algorithms, that are actually used by the most professional traders on YouTube and other social media trading influencers. Simply taking trades from our SCOBs, OFs, EQHLs and etc. won't print you millions overnight, but what these algos will do is help you with being aware of is potentially laying ahead of you with a very clean probability.
Why does it matter? It simple: better market awareness gives you an edge over other trades, which use old algorithms, which are clearly outdated, so beating such traders in the long run is just a game of time for you, so good algorithms do matter. Each indicator inside ToolBox is there to help you develop this market awareness and forge your edge bit by bit.
Now let's talk about what is inside the ToolBox.
🔍 OVERVIEW
At the moment of publishing ToolBox contains 8 indicators, so say "Hello" to:
Price Border Bands (further – PBB) ;
Ordeflow (further – OF) ;
Equal Highs & Lows (further – EQHL) ;
Previous Day High & Low ( further – PDHL) ;
Single Candle Order Block (further – SCOB) ;
Institutional Funding Candle (further – IFC) ;
Engulfing Candle (further – EC) ;
Inside Bars (further – IB) .
Some of them you may know, some of them you may not, so let's review each of them one by one.
📍 INDICATOR: Price Border Bands (PBB)
Price Border Bands indicator is a simple yet useful algorithm, based on Triangular Moving Average (TMA), which helps determine extreme price spikes, which on average act as meaningful mean reversion opportunities. It also is a good an effective "verifier" of POIs and zones of interest (further – ZOI) .
We advise on using this indicator this way:
Look for price going beyond upper or lower band of PBB;
Look for price reaching POI or ZOI;
Start searching for your entry point.
The most common sign of potential price reversal, which PBB searches for, is intense price spike, which signals about "liquidity clearing" or, in simple terms, manipulation .
Manipulation of the price inside the POI or price being "stopped" by POI is a screaming sign of the potentional following reversal. See the example of such situation on the screenshot below:
Additionally we need to talk about trend filter inside PBB, which colours the bars on the chart under certain conditions. If bars on the chart are being coloured in gray – this is your sign to stop trading on this asset? because there is risk to catch an uncomfortably big price spike, which might turn the '+' of your position's PnL in to '-'. See the example of PBB highlighting bar's of risky price zone in gray colour on the screenshot below:
In order to continue trading you need to wait for bars to stop being coloured in gray OR confirm the fact that price made Change of Character (ChoCh) in reverse to the previous direction of price, which was marked as risky by PBB.
And last but not least: if you see POI being reach by price inside the bands of PBB, then consider this POI weak and avoid trading it. See the example of weak POI inside PBB bands on the screenshot below:
📍 INDICATOR: Orderflow (OF)
Orderflow indicator is an algorithm, which detects Sell-to-Buy (furthert – STB) or Buy-to-Sell (further – BTS) manipulations, using the algorithm of impulse & correction price movement detection, taken from one of our previously built indicators – Impulse Correction SCOB Mapper (ICSM) .
Let's explain the terms from above:
Impulse – series of bars, each bar of which consecutively updated previous bar's high and then last candle broke previous bar's low ;
Correction – series of bars, each bar of which consecutively updated previous bar's low and then last candle broke previous bar's high ;
STB – a type of price manipulation, which can be described as a correction of price inside global upward movemnt;
BTS – a type of price manipulation, which can be describd as a impulse of price inside global downward movement.
Unlike traditional order blocks, which are often narrower and more selective, Orderflow zones cover a wider price range and present a higher probability of mitigation. This makes them more reliable for entries in ovaerage in comparison to classic orderblocks.
Let's review examples of bullish and bearish orderflows on the screenshots below:
Bullish orderflows (STBs) (blue boxes with "OF" text inside)
Bearish orderflows (BTSs) (orange boxes with "OF" text inside)
The usage of ZOIs, detected by OF algorithm, is pretty straightforward: take trades against the ordeflow block, that price has reached. Even though we don't recommend relying on Orderflow blocks as sole producers of signals, you can use them as such in way, that can be described like this:
Place stop-loss (SL) beyond the furthest border of OF block (bottom of the bullish OF or top of the bearish OF), that price has reached;
Aim for >2:1 RR ratio and place your take-profit (TP) accordingly.
You can see the example setups of OF blocks as signal producers on the screenshots below:
Examples of LONG trades, taken from price reaching bullish OF block.
Examples of SHORT trades, taken from price reaching bearish OF block.
Summarising, Orderflow can be described as a tool that helps determine the STB and BTS price manipulations, which are great price ZOIs and can be used both as confirmation tools for your exisiting signals and sole signal producers, in which case such they needed to be handled extra mindfully and preferrably bonded with other tools for additional confirmation. We personally recommend using Ordeflow as confirmation tool, because ZOIs, detected by Orderflow, are usually the price ranges, around which traders tend to place their stop-losses, which only gives more strength to these zones for supporting the price and helps traders with "trading from support/resistance" strategies gain additional edge.
📍 INDICATOR: Equal Highs & Lows (EQHL)
EQHL indicator is an algorithm, which scans the extremums of impulse and correction movements, detected by our ICSM indicator , and marks ones which are roughly or equaly placed on the same price levels. Equal highs (further – EQH) and equal lows (further – EQL) are local liquidity pools, where stop orders and resting orders cluster; price often gravitates to these zones for liquidity “top-ups,” after which a reaction or continuation to the next liquidity source may occur. Basically, EQHL algorithm highlights clusters of equal extremes as navigational anchors for “collect → react → confirm” scenarios.
Talking about usage, we advise to not take swept or reached EQHLs as entries by themselves. Evaluate them alongside HTF structure, Inducement (IDM), orderblocks (OB), orderflow (OF), candle pattern context (e.g., IFC/EC) on the LTF and etc. Intended usage scenario of this algorithm is something like this:
Price reaches EQH/EQL;
Price hangs around the reached EQH/EQL;
Another tool (for example, OF or OB) signals about price reversals from the level of reached EQH/EQL;
Trader starts looking for an entry.
See the examples of EQHLs, which algorithms maps on the chart, on the screenshots below:
Equal Lows (EQLs)
Equal Highs (EQHs)
📍 INDICATOR: Previous Day High & Low (PDHL)
PDHL indicator is an algorithm, princples of work of which can be derived from its name: algorithm tracks previous day's high and low and displays it on the chart.
Previous day's high and low are fundamental POIs in any financial market, which are traded not only by SMC traders, but by many other traders, especially by traders, which consider these POIs are one of the most crucial, because they usually highly liquidity-rich and can signal about wondeful reversal opportunities.
We expect traders to use PDHL algorithm as confirmation tool when trading by mean reversion strategies. Usage of PDHL as signal source is advised against, but traders are free to experiment nevertheless.
PDHL algorithm shows two types of PDHLs on the chart: active PDHL (solid line) and swept PDHL (dashed line) . You can the examples of PDHLs, detected by our algorithm, on the screenshot below:
📍 INDICATOR: Single Candle Order Block (SCOB)
SCOB indicator is an algorithm, which marks a very specific POIS, which are based on of the most simple yet highly profound SMC and candle pattern principles and are usually a good alternative for classic orderblocks.
Principles of SCOB detection are very simple:
Price sweeps previous candle's extremum (high/low). So called "liquidity sweep" ;
Immediately after step 1 price forms a fair value gap (FVG).
You can see basic examples of bearish and bullish SCOBs on the screenshot below:
As a matter of fact, SCOB can be used both as a confirmation tool and source of signals. However! To be a source of signals, SCOB is most suitable to be used while trading on lower timeframe (LTF), while trading on a higher timeframe (HTF) on average requires to look at SCOB as a POI rather than as independent source of signals. That being said, we would like additionally to point out, that due to the nature of SCOB being an orderblock, this tool by its nature is best suitable as confirmation tool and we expect traders to use it as such, but either way this indicator is quite multifunctional and can be used by each trader for a more specific purposes.
SCOBs, which are detected by our algorithm, are painted on the chart either as coloured candles (SCOBs without inside bars) or coloured boxes (SCOBs with inside bars) . You can see examples of SCOBs, which were detected by our SCOB algorithm, on the screenshot below:
📍 INDICATOR: Institutional Funding Candle (IFC)
IFC is a candle, which is a more strict version of SCOB. Our algorithms detects an IFC, if SCOB satisfies these conditions:
SCOB candle has large shadow (more than 50% of candle's body);
SCOB candle has large range ( | high - low | is more than a certain value, which is base on ATR).
That's basically it! Being simple as that, IFC represents itself as a high-trust SCOB, which on average has larger chance of reversing price when IFC candle is reached by it and our practice shows that it is indeed the case. IFC candles are usually go hand in hand with large price and volume spikes, which are believed to be caused by large institutional players, who trading eager to catch retail trader's stop orders, which they usually place around POIs like IFC and SCOB.
We expect traders to use IFC as a tool for entry confirmation bias, especially when considering IFC from HTF.
You can see IFC, which our algoritms detects on the chart, on the screenshot below:
📍 INDICATOR: Engulfing Candle (EC)
An Engulfing Candle is a candle, which occurs when the current candle’s body engulfs the prior candle’s body, showing a short-term shift in demand/supply balance. In SMC context, it is most useful around POIs/liquidity as a contextual confirmation element. The indicator marks bullish and bearish EC without implying a “must reverse” outcome – it’s a focus cue, not a promise.
As with any other alike tool, this algorithm should not be used as sole source of signals, but rather as a confirmation tool. ECs near support/resistance zones or POIs are typically more impactufl than those inside choppy consolidations. Structural and LTF price impulse confirmation usually enhances existing position bias in a positive way.
You can see examples of engulfing candles on the screenshots below:
Bullish engulfing candles
Bearish engulfing candles
📍 INDICATOR: Inside Bars (IB)
Inside Bars are bars, which are contained inside the range of high and low prices of the bars preceding them. This algorithm was designed to showcase periods of potential price consolidation/volatylity compression and quite often precedes price movement towards closest liquidity POIs and ZOIs. When price finally breaks out of its previous range, it usually provides good opportunities for entering trades using breakout strategies (especially ones, that are based on SMC principles) .
You can see examples of IBs, which are detected by our algorithm on the chart, on the screenshot below:
That was a long list of features, now let's talk about settings now.
🔔 WHAT ABOUT ALERTS?
At the moment of publishing this indicator includes alerts for all algorithms, which are included inside, except for Inside Bars (IB) algorithm .
⚙️ SETTINGS
At the moment of publishing most of the settings in this indicator are about styling for indicator's visuals, because by design most of the included algorithms (excluding PBB) don't rely on inputs of any technical kind. Let's review them.
ToolBox | General Styling
Text Size – (Tiny, Small, Normal, Large) – defines text size of indicator's visuals, which use text-based visuals.
Price Border Bands | Main Settings
Show Price Border Bands – toggles on/off the display of PBB;
Half Length – defines amount of bars, used for calculation of the PBB's TMA;
Price Source – defines price source for PBB's TMA;
ATR Multiplier – affects the width of PBB's bands;
ATR Period – affects the amount of bars for ATR calculation.
Orderflow (OF) | Settings
Bullish OF – toggles on/off the display & colour of bullish OF;
Bearish OF – toggles on/off the display & colour of bearish OF;
Show border – toggles on/off the display of OF blocks' border.
Single Candle Order Block (SCOB) | Settings
Show SCOB – toggles on/off the display of SCOB;
Bullish – toggles on/off the colour of bullish SCOB;
Bearish – toggles on/off the colour of bearish SCOB.
Equal High/Lows (EQHL) | Settings
Show EQH/EQL – toggles on/off the display of PDH/PDL;
EQH – toggles on/off the colour of EQH;
EQL – toggles on/off the colour of EQL.
Institutional Funding Candle (IFC) | Settings
Show IFC – toggles on/off the display of IFC;
Bullish – toggles on/off the colour of bullish IFC;
Bearish – toggles on/off the colour of bearish IFC.
Previous Day High & Low (PDHL) | Settings
Show PDH/PDL – toggles on/off the display of PDH/PDL;
Show PDH/PDL – toggles on/off the display of the past history of swept PDH/PDL;
Show previous day divider – toggles on/off the display of dashed gray line, which separates new day from previous one;
Bullish – toggles on/off the colour of bullish IFC;
Bearish – toggles on/off the colour of bearish IFC.
Engulfing Candle (EC) | Settings
Show engulfing candles – toggles on/off the display of EC;
Bullish – toggles on/off the colour of bullish EC;
Bearish – toggles on/off the colour of bearish EC.
Inside Bars (IB) | Settings
Show inside bars – toggles on/off the display of IB;
Bullish – toggles on/off the colour of bullish IB;
Bearish – toggles on/off the colour of bearish IB.
Alerts | POI
Alert Frequency – (Once Per Bar, Once Per Bar Close) – defines alert frequency of the indicator's alert for all POIs;
* all other buttons from this group of settings toggle alerts on/off.
PBB;
OF;
SCOB;
EQH;
EQL;
IFC;
PDH;
PDL;
EC.
🏁 AFTERWORD
SMC ToolBox indicator is designed to be the ultimate swiss knife, which might bring you quantifiable results when trying to crack the market's secret of where the liquidity is placed. This indicator doesn't produce any particular signals not it gives any financial advice, but it helps you deepen understanding about potential existing liquidity zones and price points by employing principles of SMC algorithms, which are most commonly used by retail traders on a daily basis.
You can view this indicator as a Christmas candy box: you pick only the candles (indicators) you need and want. We expect any trader to use this indicator by exactly same way: you should take onlt the things you need to enhance your strategy, not worrying about what to do with other indicators, fi they don't suit you.
Lastly, we would like to share our team's recommendations (they are optional, of course) on how to use certain POIs from ToolBox:
Use PBB as a filter for validating POis. Pay close attention to the rule "don't trade POIs, which are located inside the bands of PBB" (described above in "INDICATOR: PBB") ;
Use Orderflow to find short-term and mid-term trading opportunitions for trend-following strategies, using OF blocks as resistance in bearish trend and support in bullish trend;
Use EQHL and PDHL indicators when trading by mean-reversion strategies on intraday timeframes. These indicators will be especially of use to forex, stock and crypto traders;
Use SCOB and IFC indicators when trading by mean-reversion strategy to find short-term reversal opportunities;
Use ECs and IBs as confirmation/denial tools for your entry ideas. We recommend avoiding trading If price is currently going inside HTF's IB range.
We have no doubts that SMC ToolBox indicator will be of use to any trader, who employs and desire to employ SMC principles in his strategy. We will be waiting for your feedback, meanwhile you can ask your questions in the comments :)
Sincerely,
WinWorld team.
